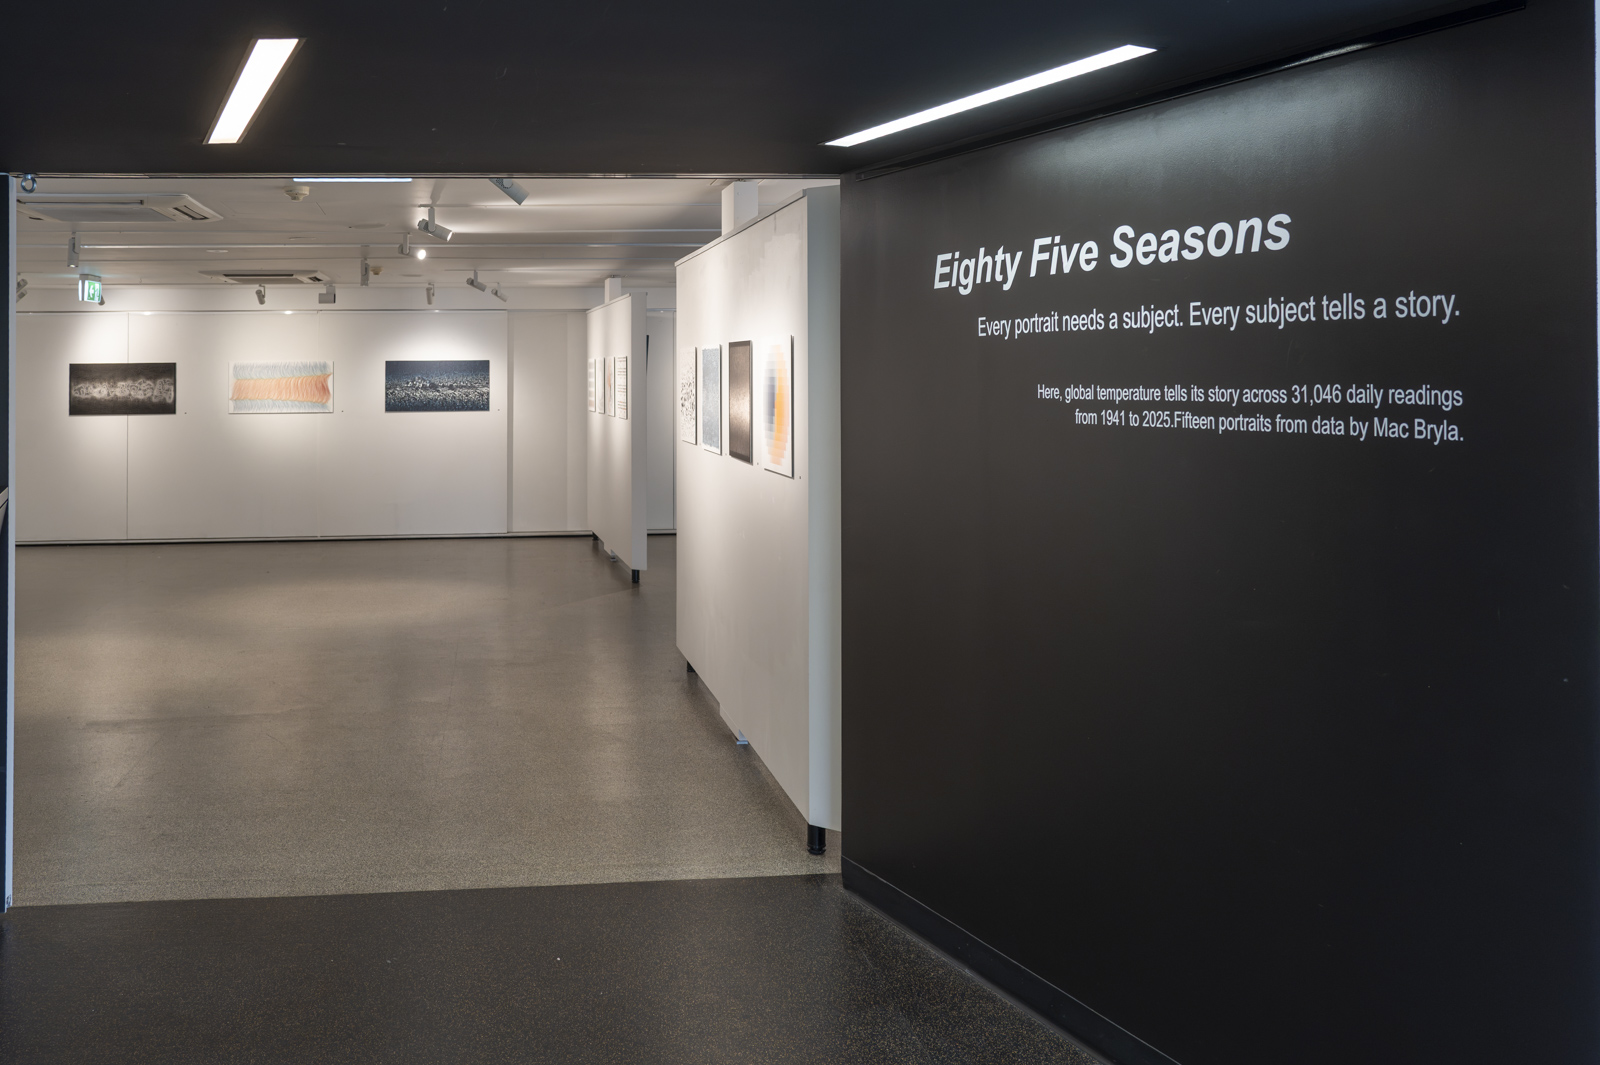
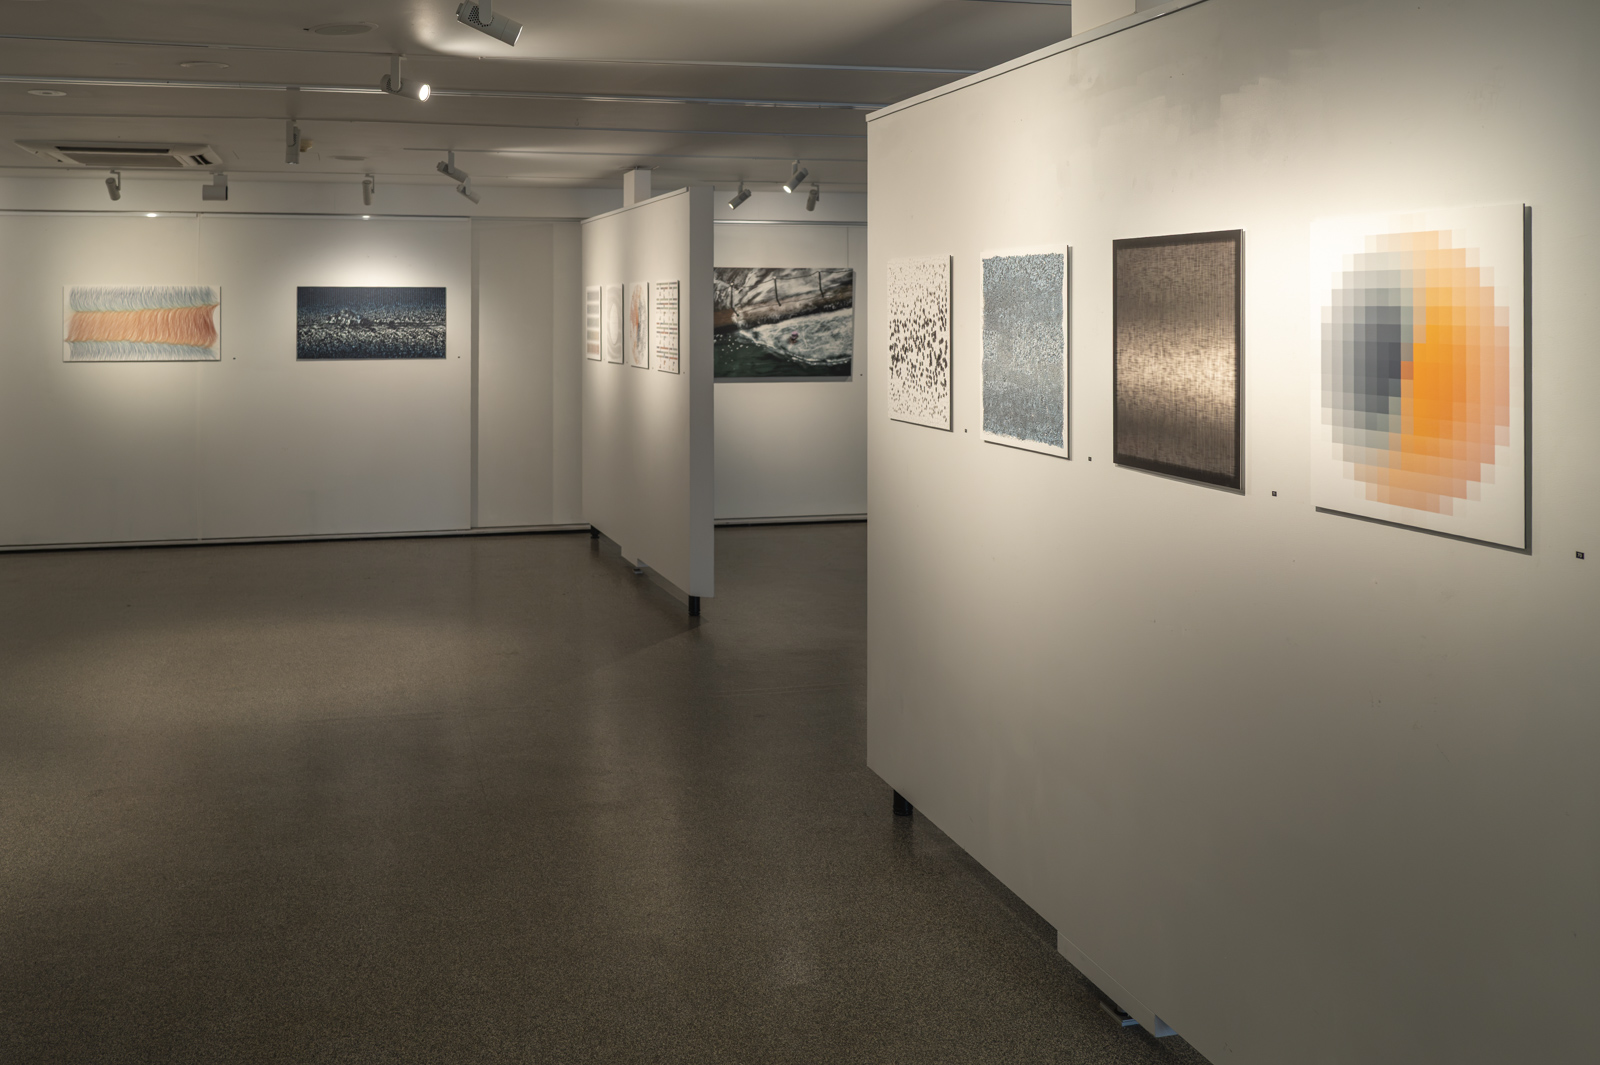
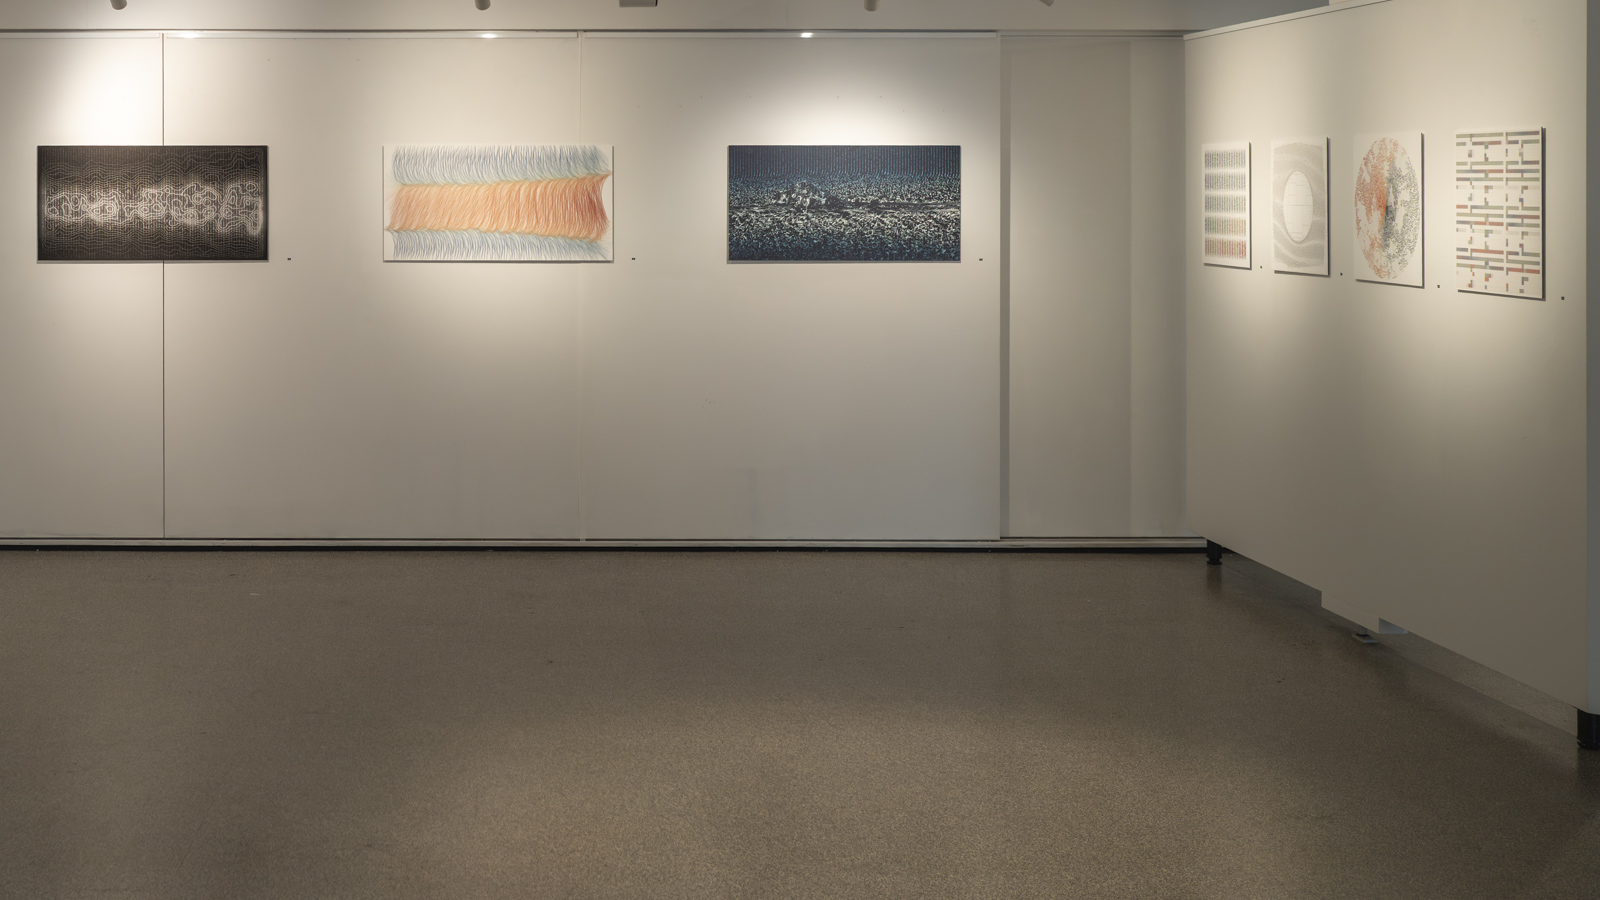
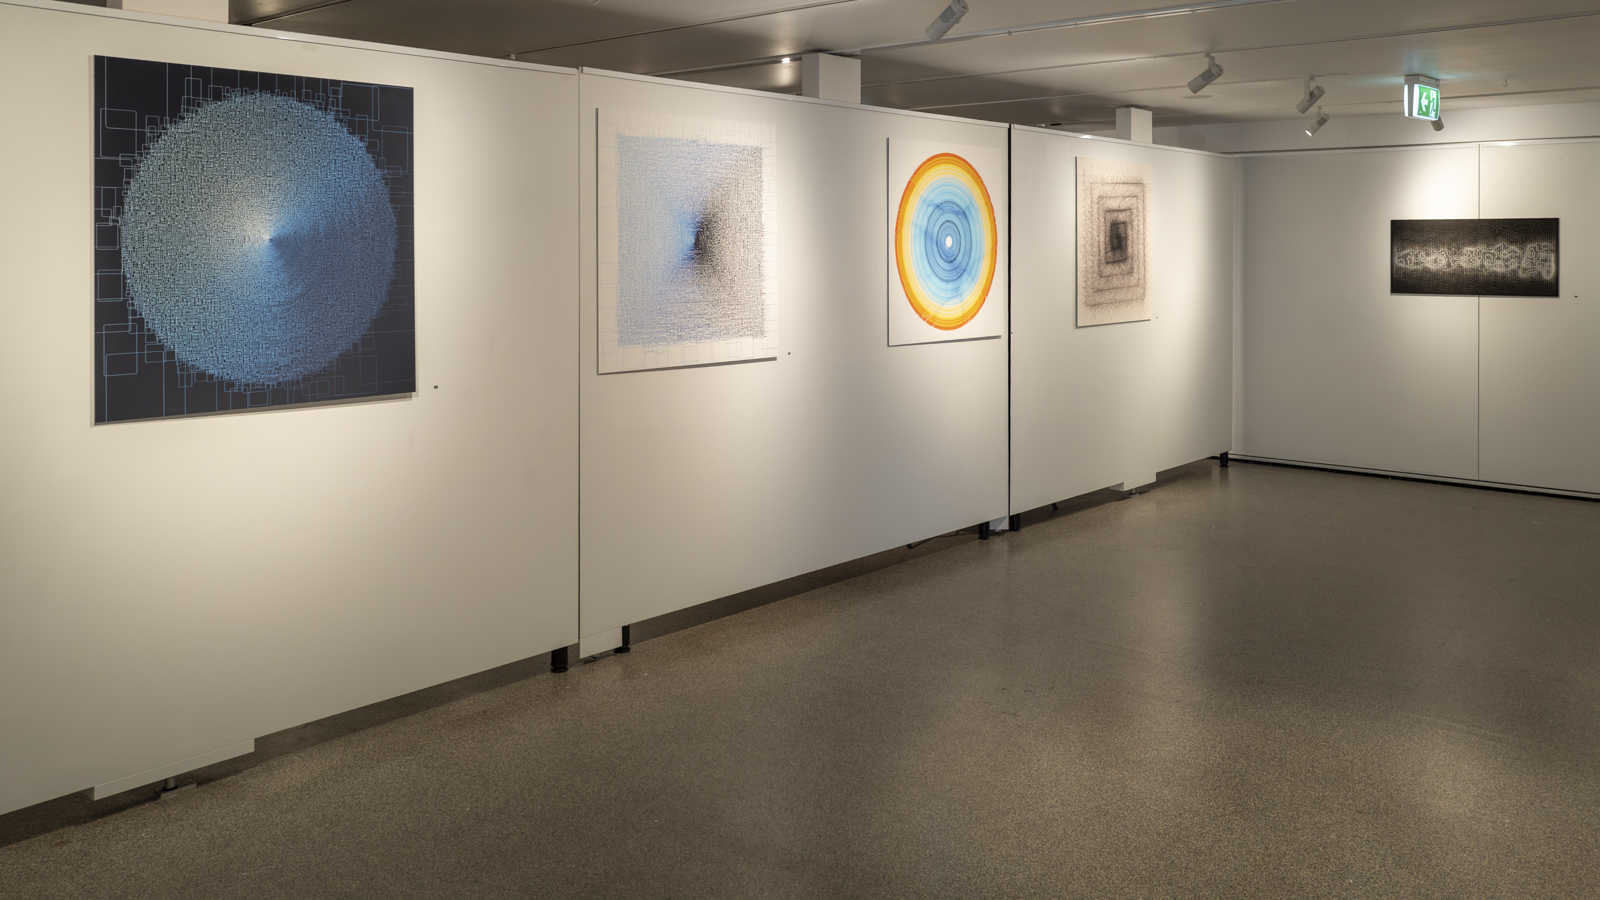
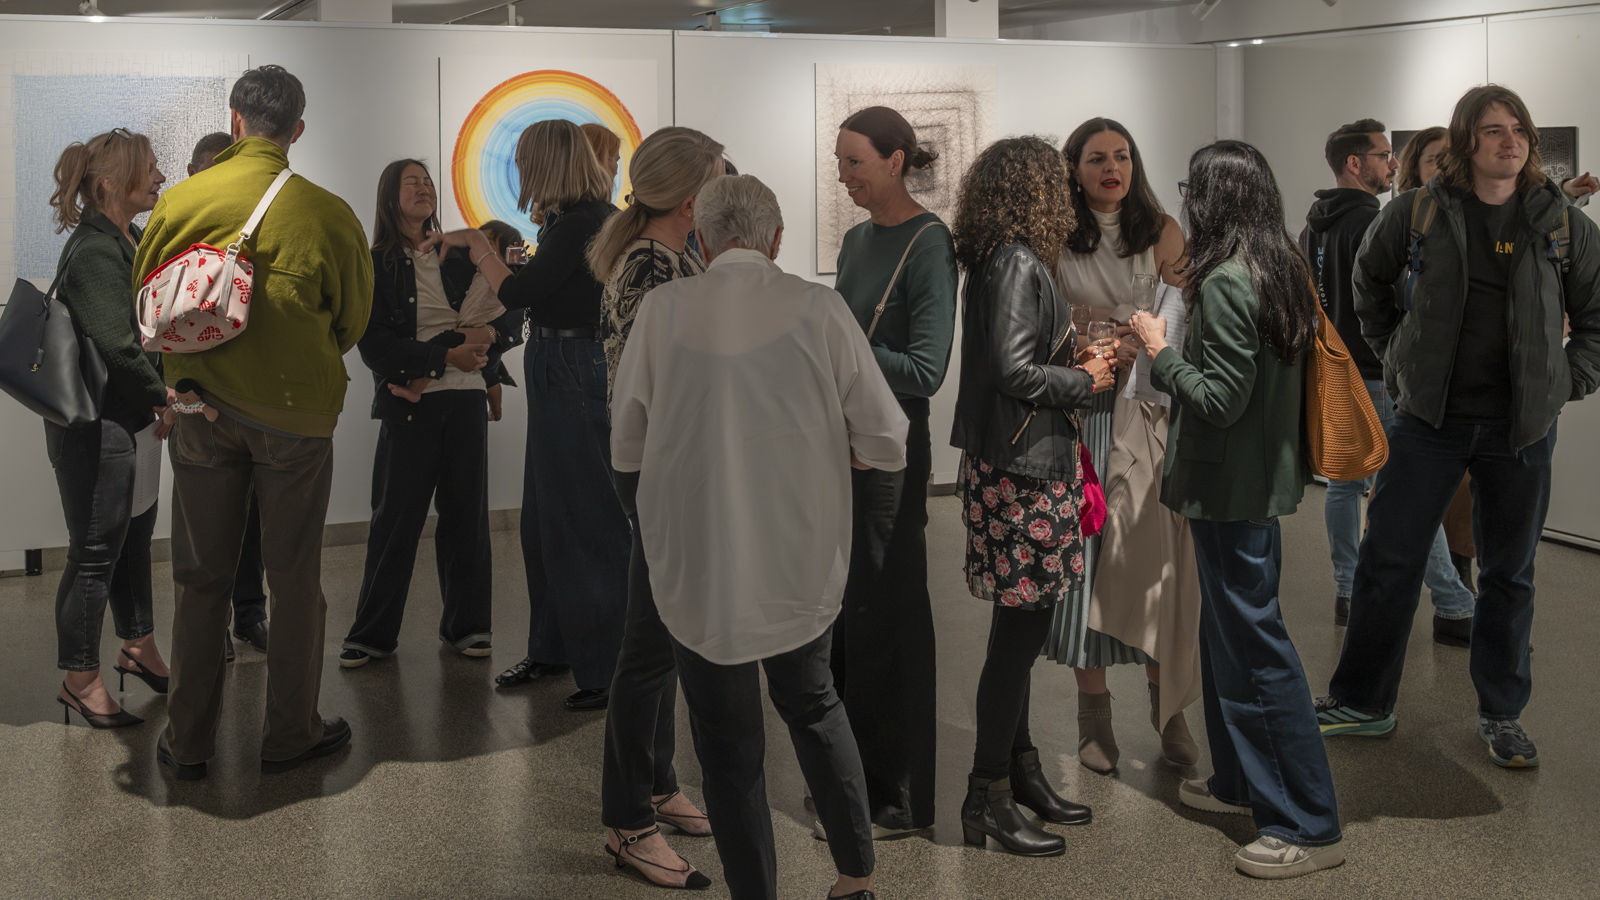
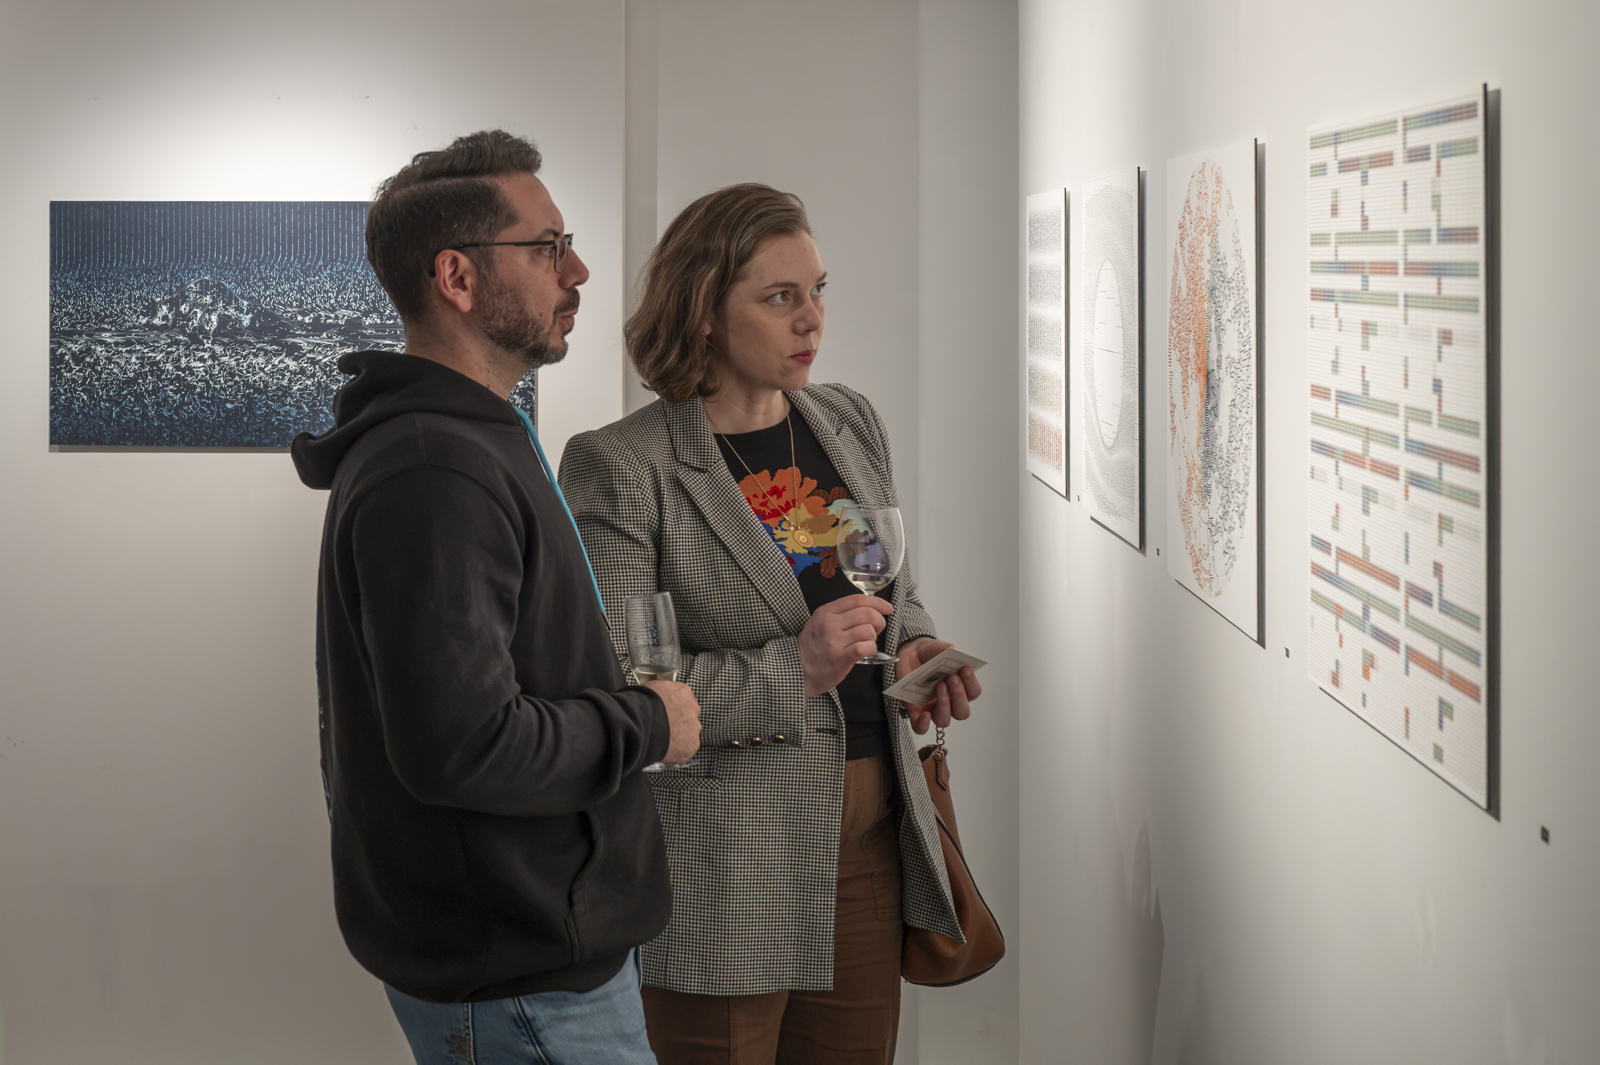
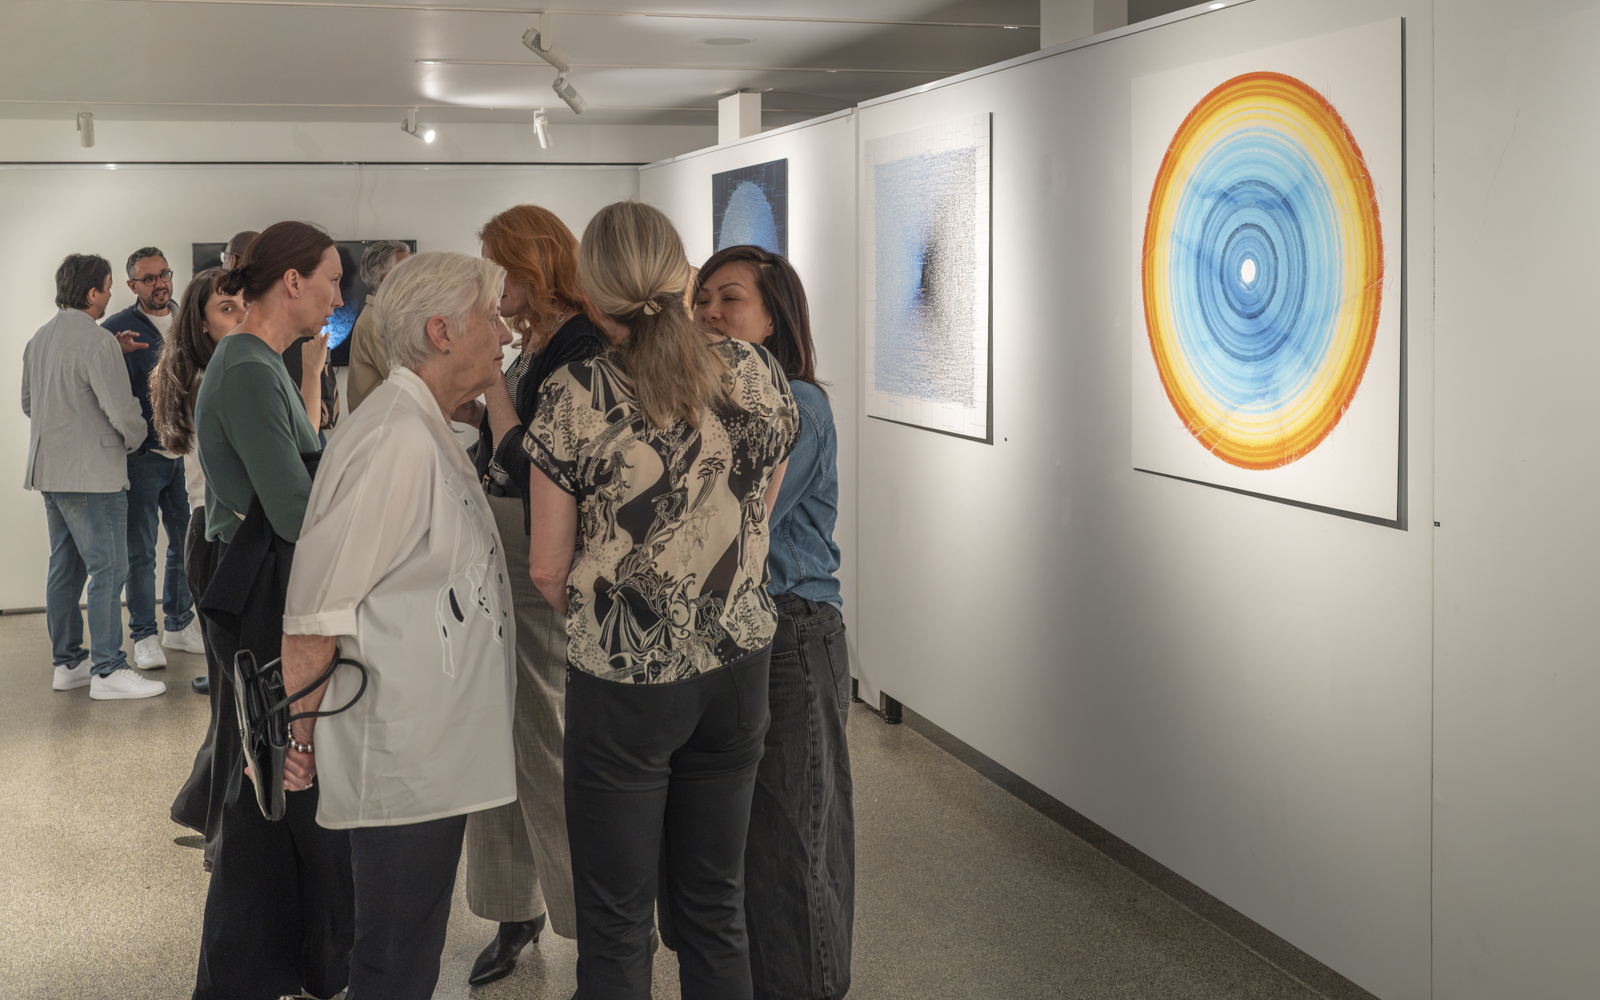
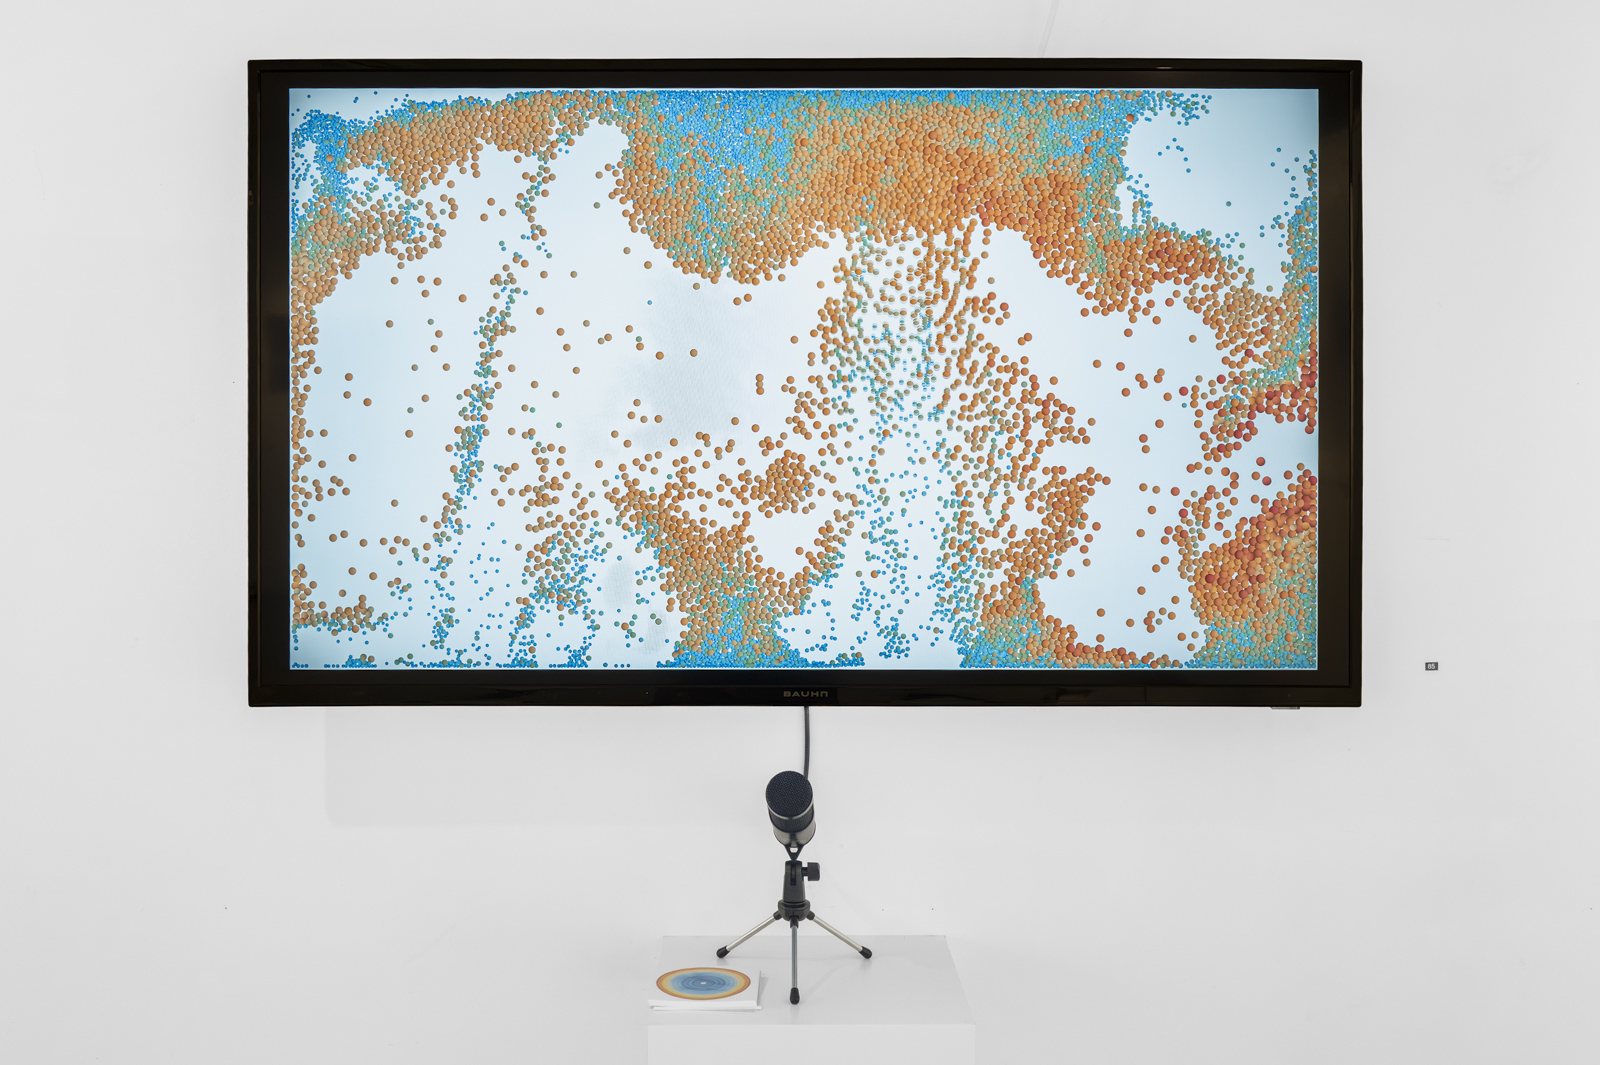
Click a work for a larger view, the story behind it and its price.
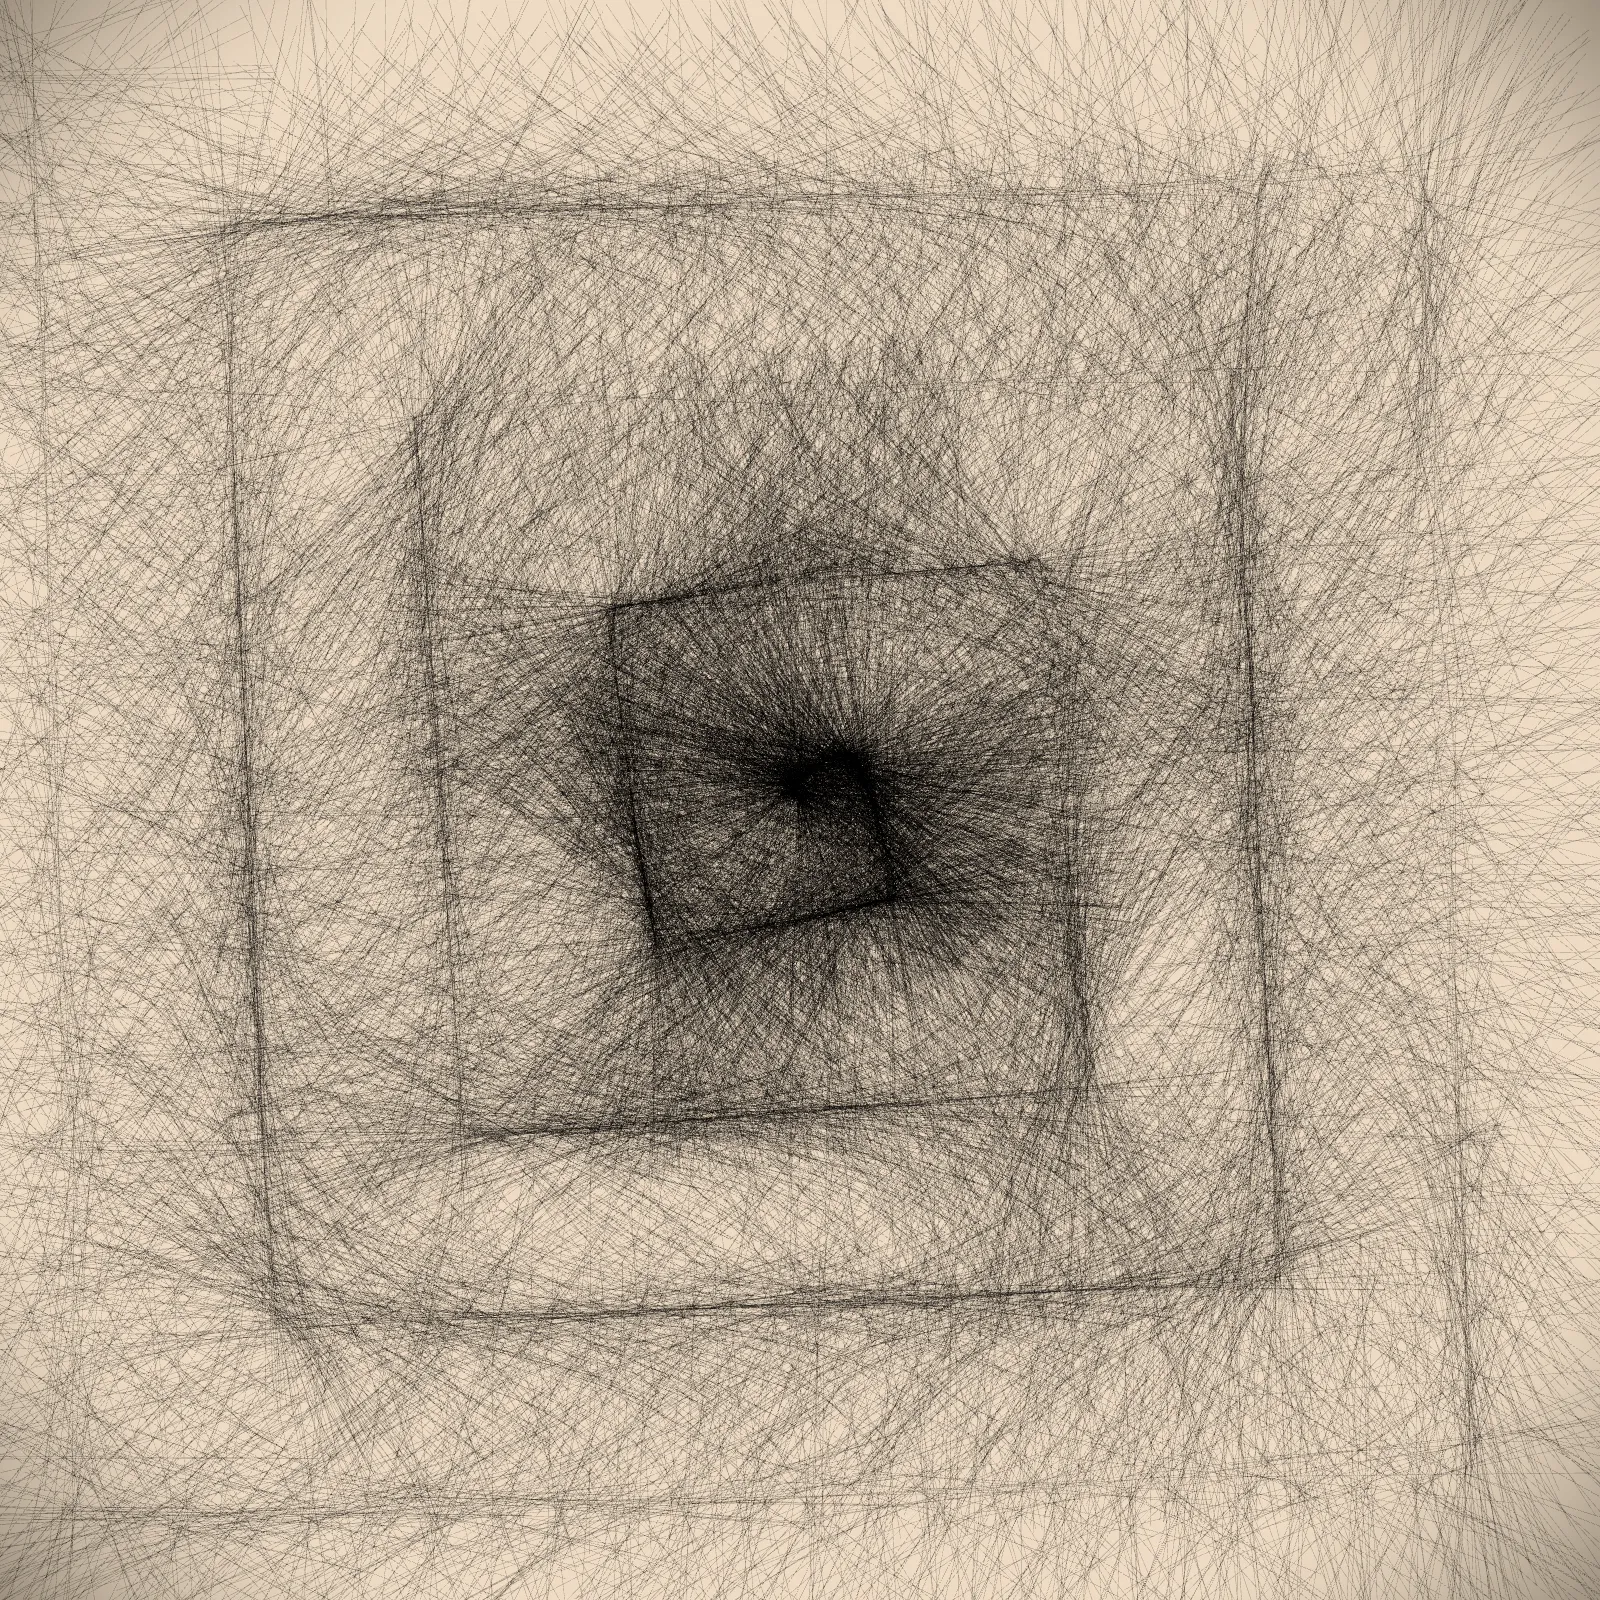
25.023This began as a square spiral that I let become more and more intertwined. Every line is a single day, fine as a hair, turned to its own angle by its own temperature. Alone each one says very little. Together they tangle and cross, connected and complicated, until I can no longer tell where one ends and the next begins.100 x 100 cm · edition of 5$1,850
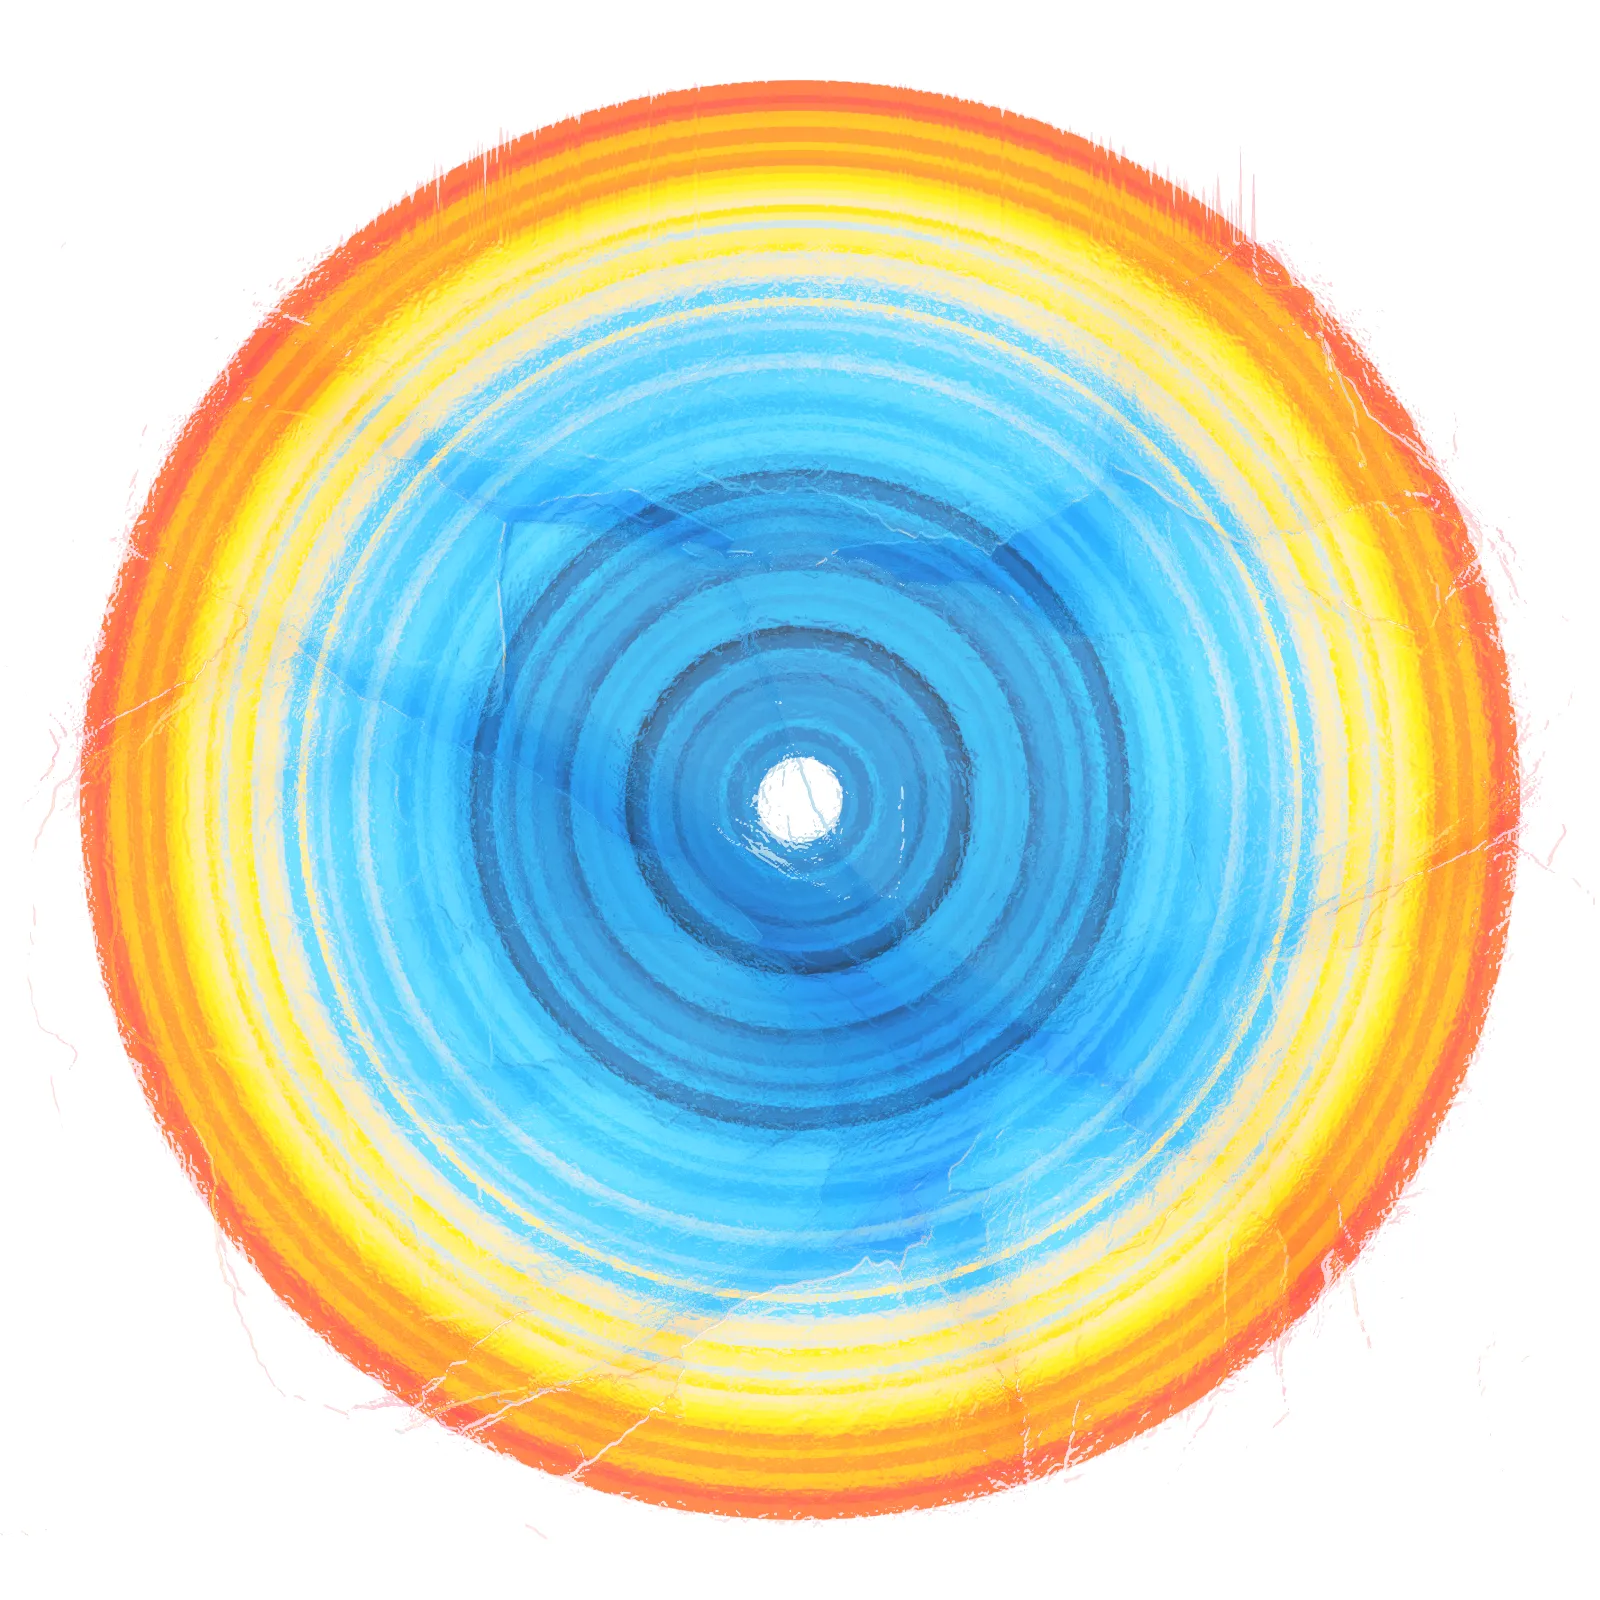
26.019A tree keeps its years in rings, and I wanted the planet to do the same. Each ring is one whole year, held as a single colour, blue at the heart and orange at the edge. Over it sits my photograph of a cracked and unstable iceberg in Antarctica. The rings take on its fractures, years of growth laid over something already breaking.100 x 100 cm · edition of 5$1,850
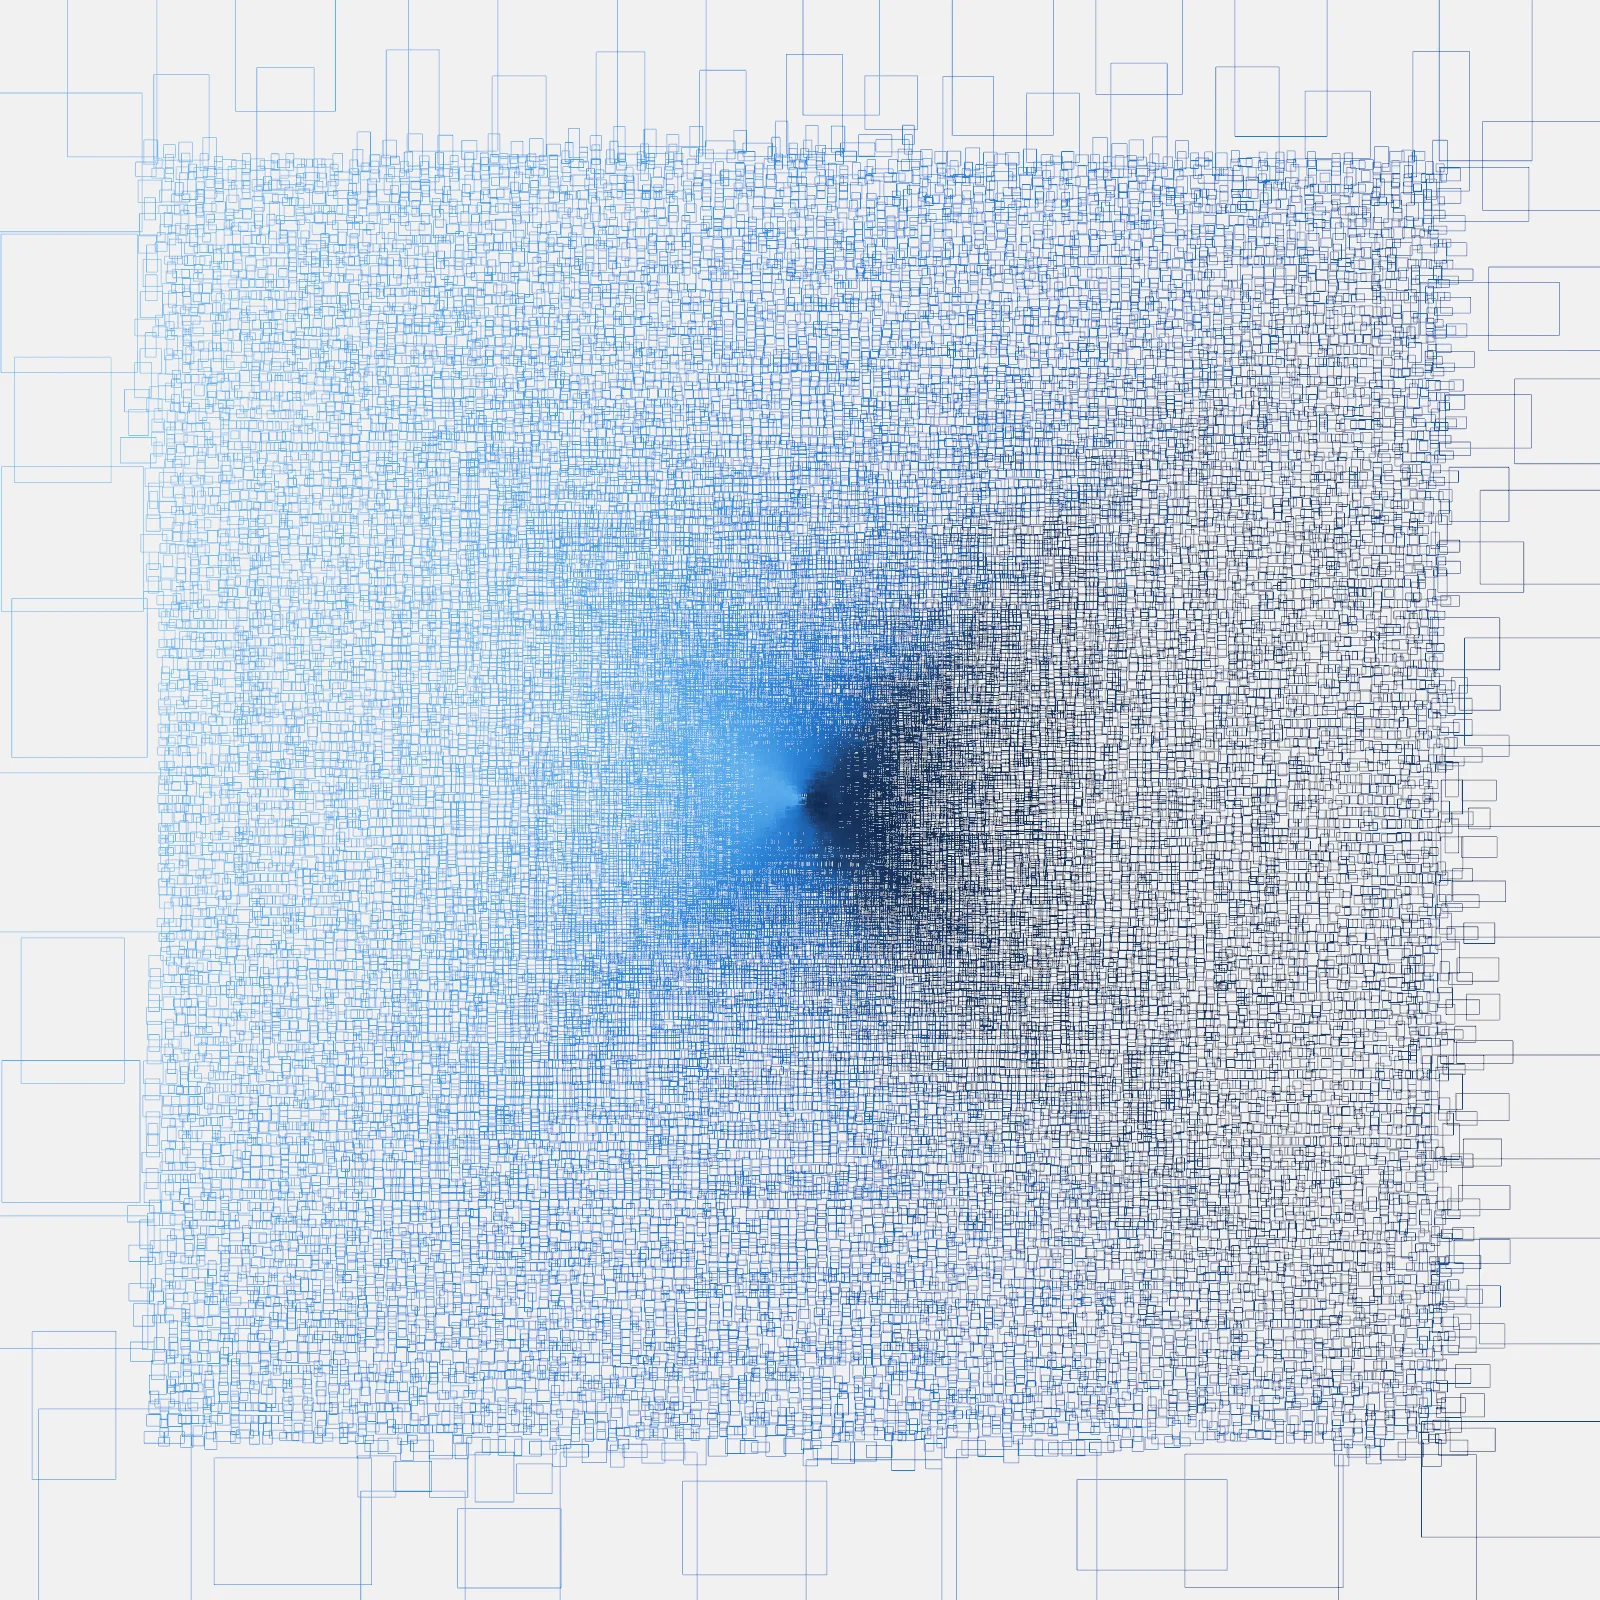
25.004I was trying to fit half a planet into a square. These are the days of the southern half, our half, and every one of them is competing for space. Each is pushed and shaped by those around it, tight at the centre and loosening towards the edge. I am still not sure what that means, but nothing here is free of its neighbours.100 x 100 cm · edition of 5$1,850
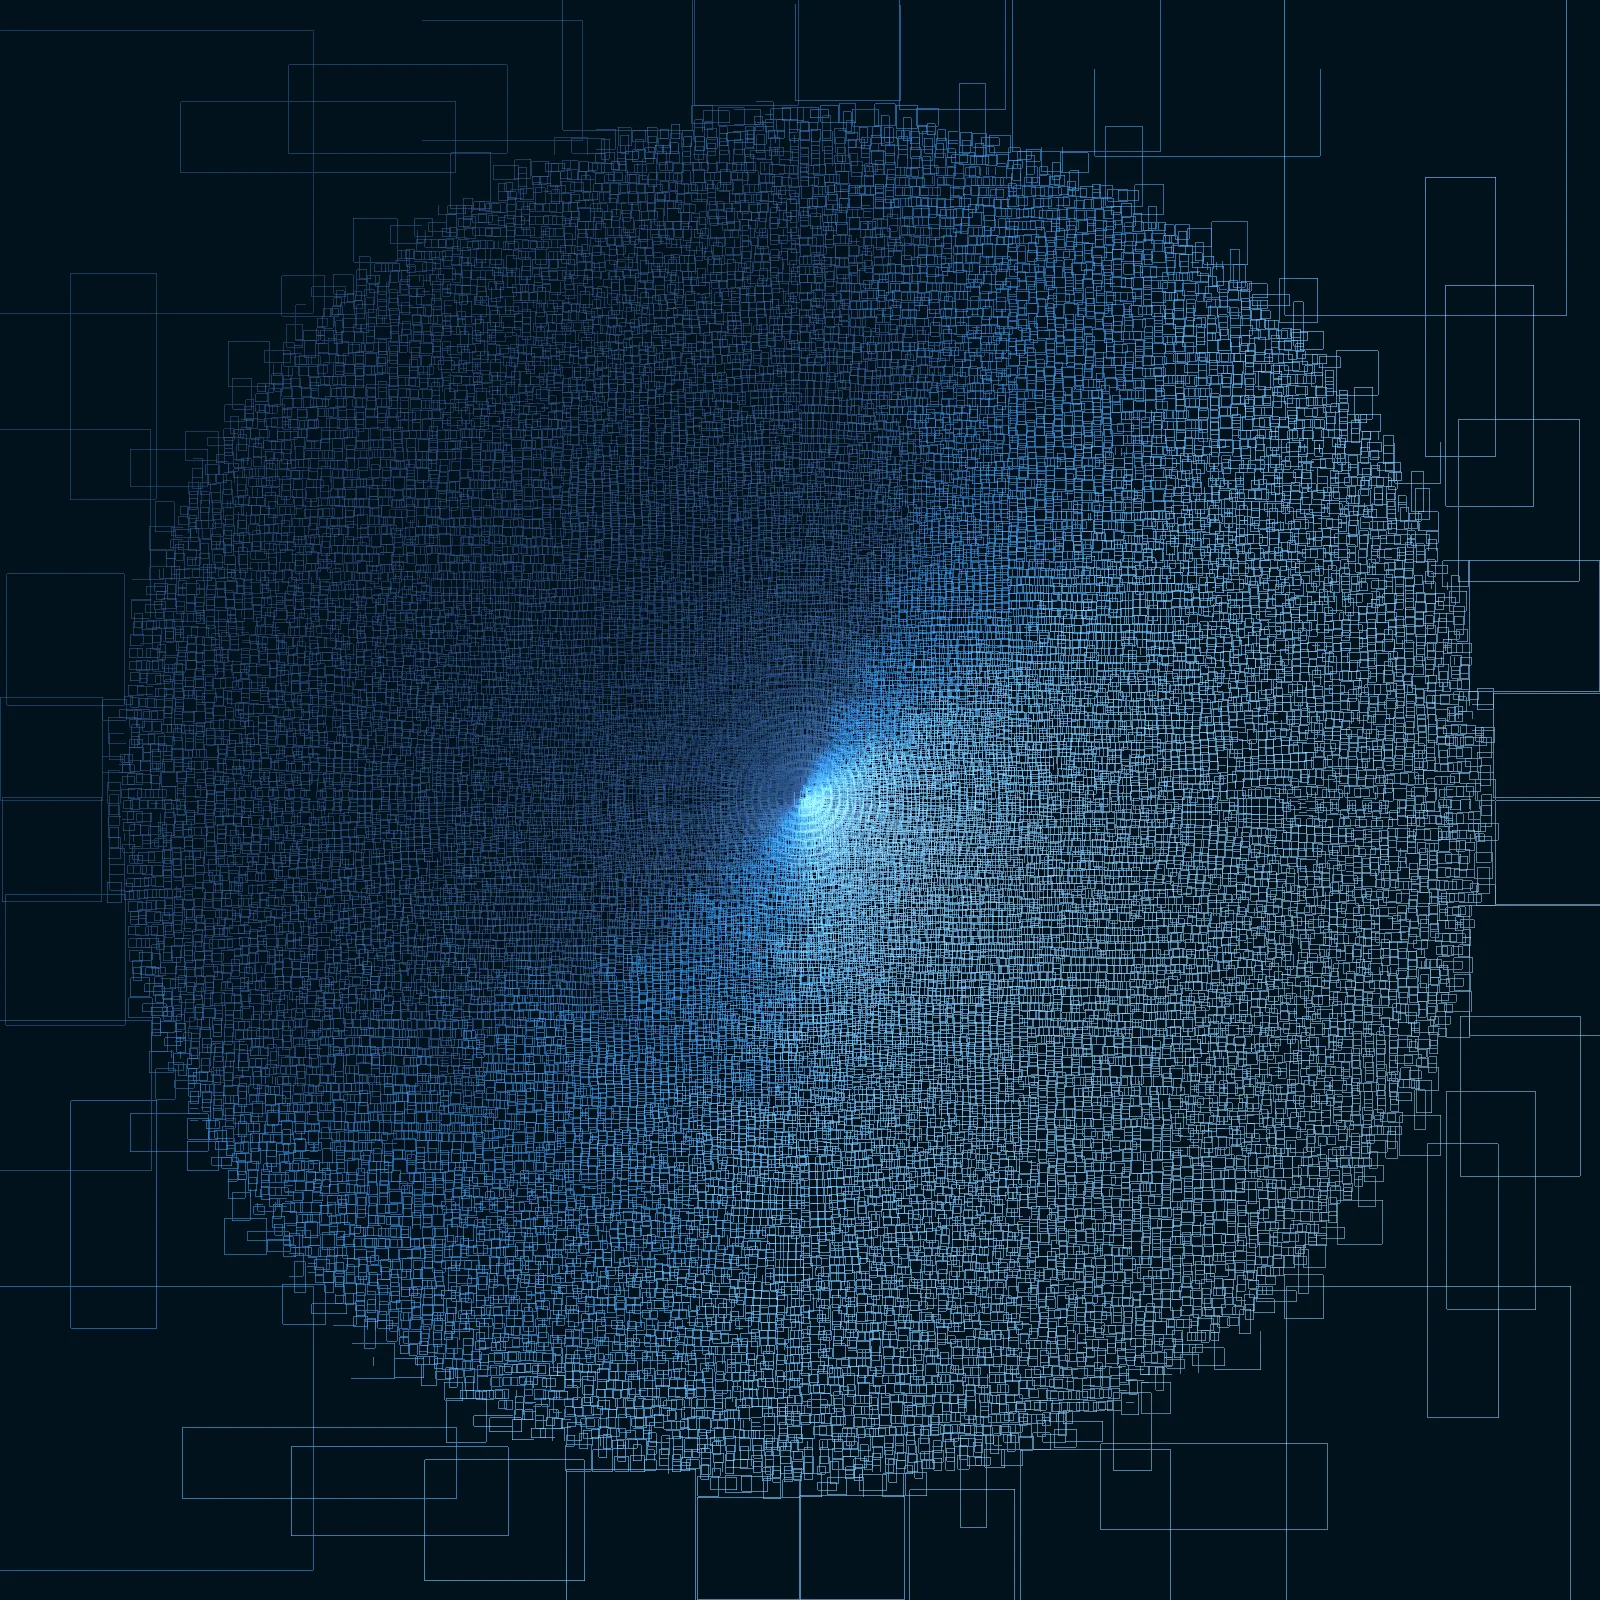
25.005Every day of those eighty five years is here, each one a single shape competing for its place. I started time at the centre and let it work its way outwards, so the earliest days sit in the middle and the most recent on the edge. The brighter shapes are summers and the darker ones are winters. Eighty five summers and winters, wound around a single point of light.100 x 100 cm · edition of 5$1,850
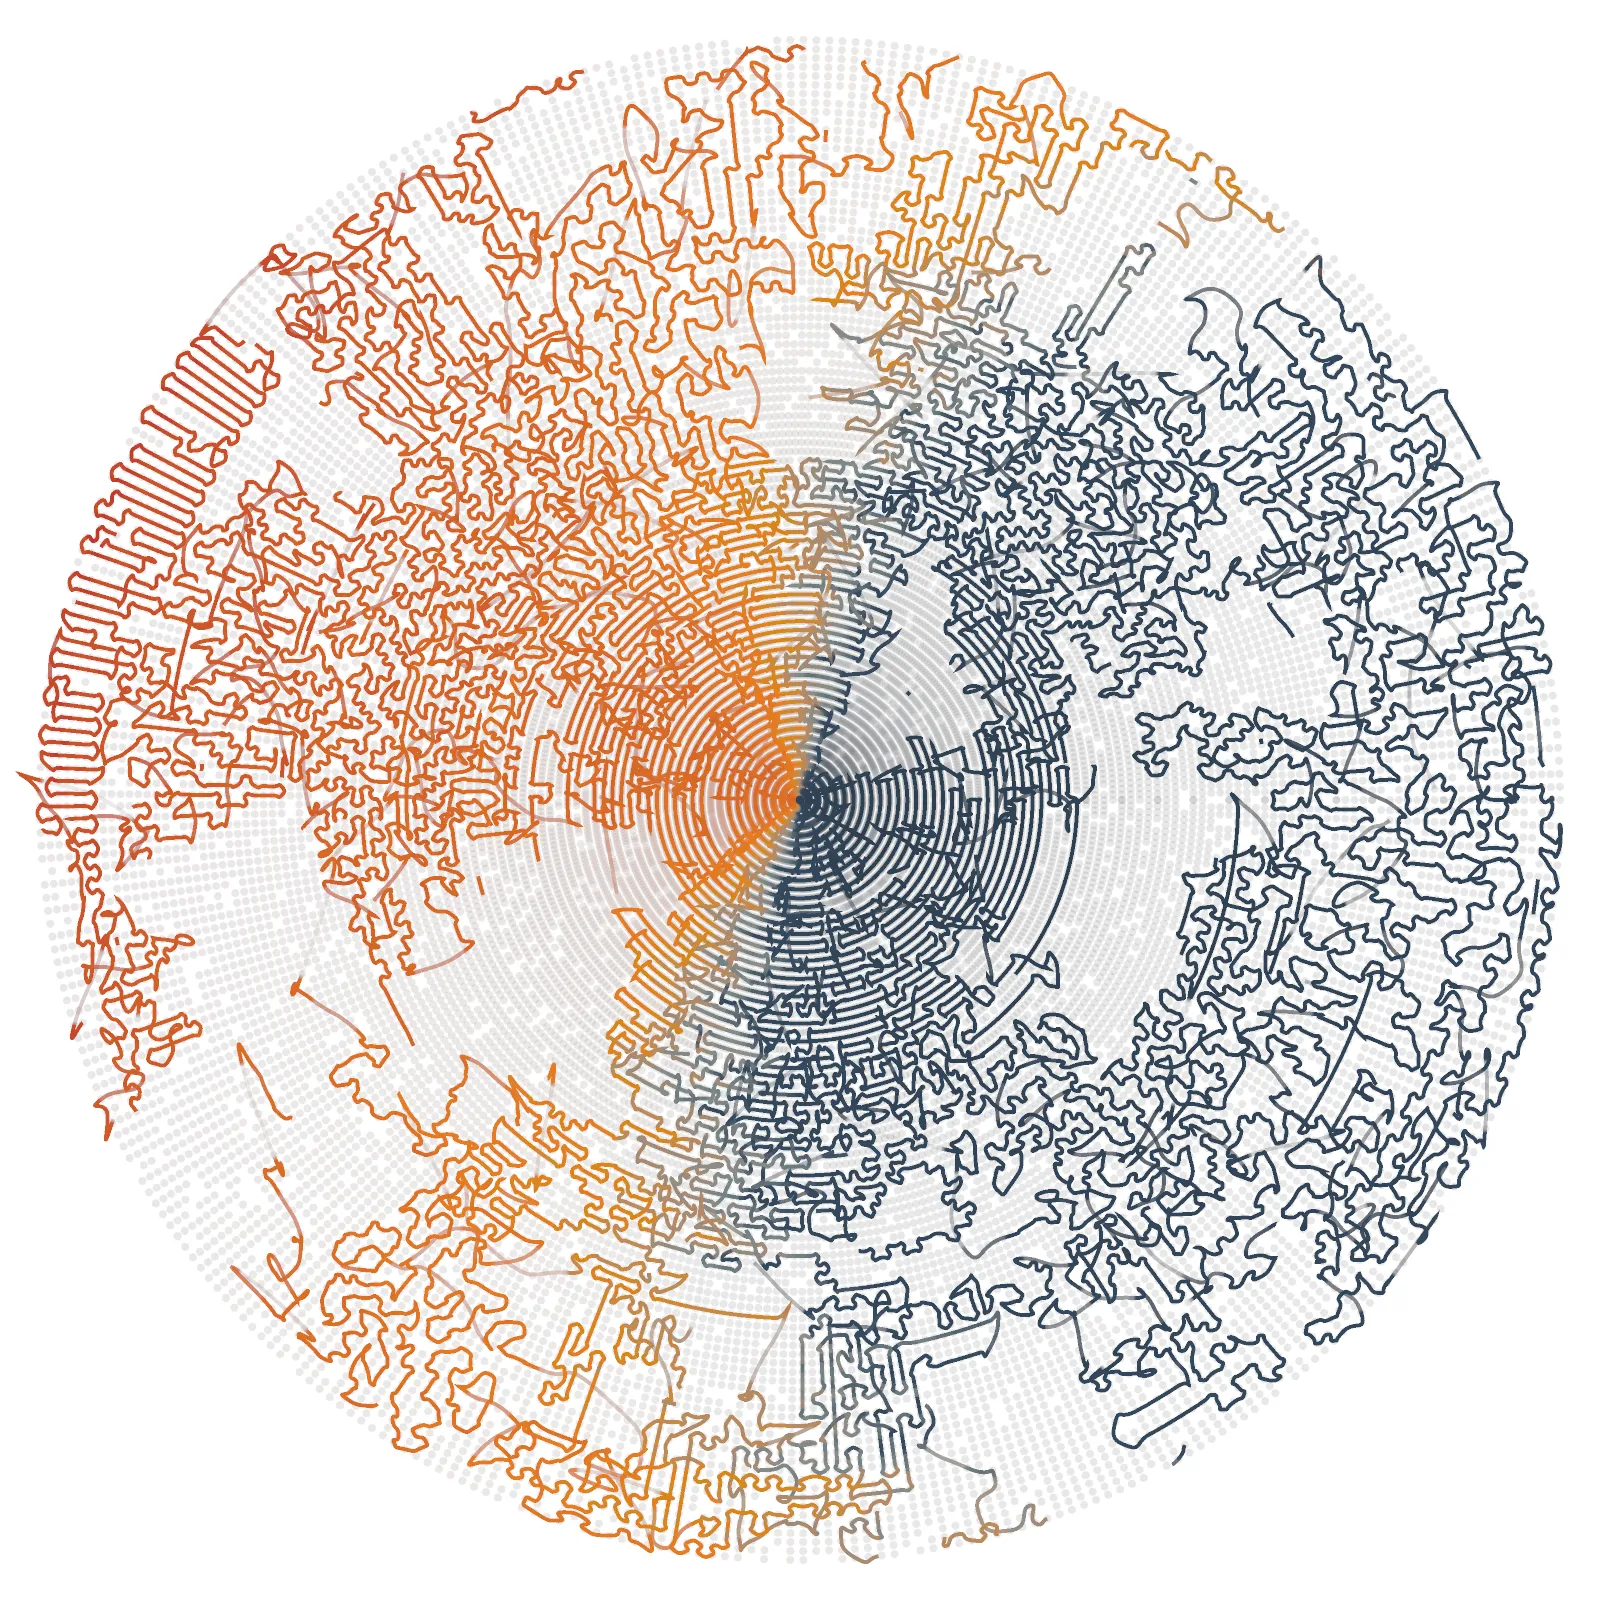
25.012What drew me here was how everything connects, each day influencing the others. Every grey dot is a moment in time with its own temperature. The lines run between them, neat rings at the centre that loosen outwards and break apart, something like a coastline from the air. Thousands of separate moments, and not one of them on its own.50 x 50 cm · edition of 10$850
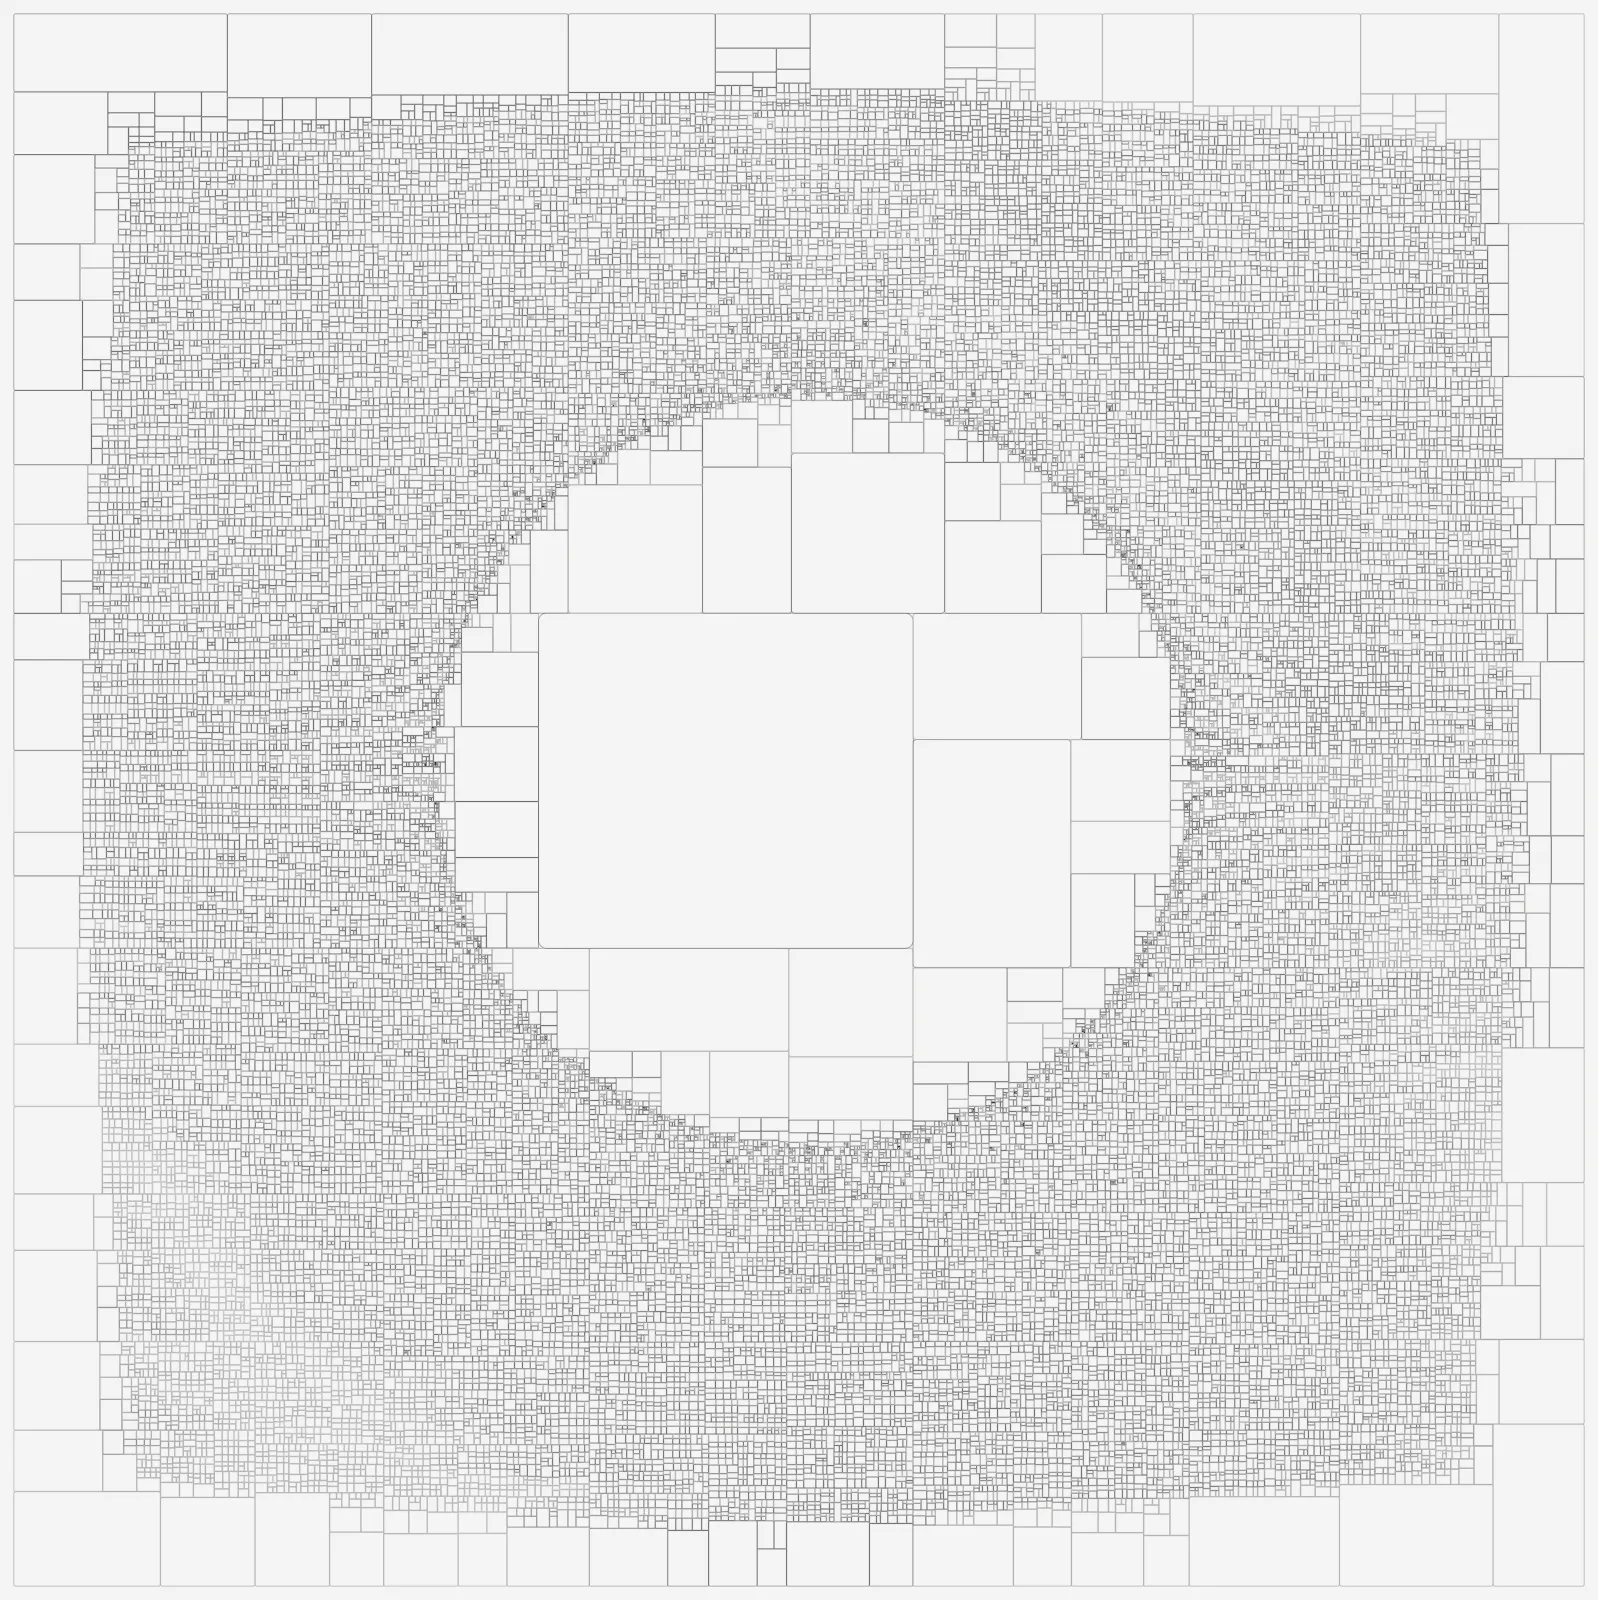
26.006I imagined a magnet at the centre, repelling everything around it. The days are pushed outwards and packed tight, and what opens up in the middle is a quiet room of large empty shapes. When so much is pressed together, the detail disappears. This was my way of zooming in on what we do not see.50 x 50 cm · edition of 10$850
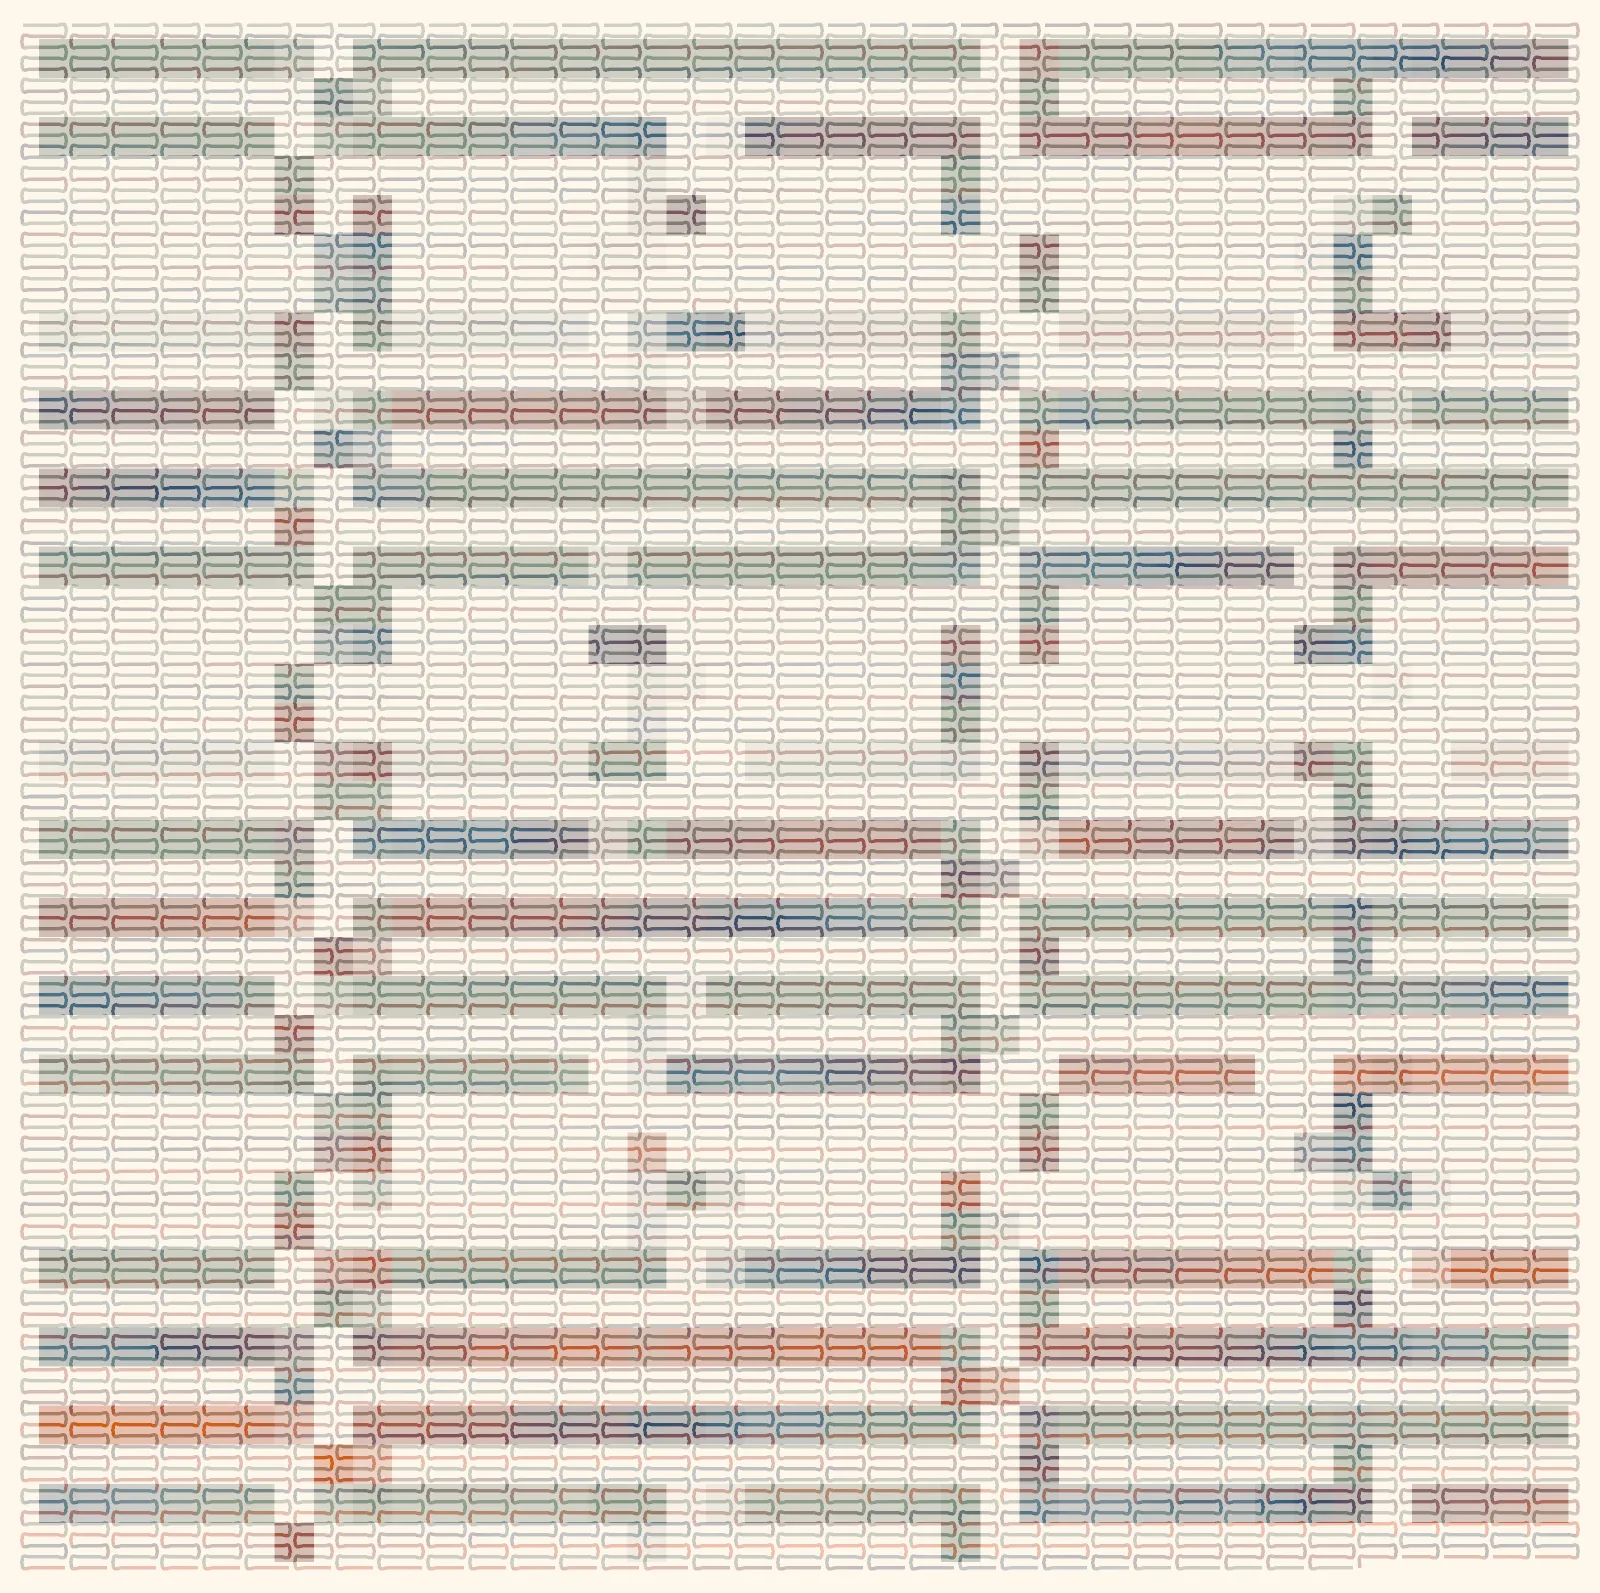
26.008To me this is a maze, almost a game. It has something of the punched cards that once told looms what to weave, but I keep finding dead ends. Rows of small links run along and then stop, and blocks of blue, rust and sage sit in the way like obstacles.50 x 50 cm · edition of 10$850
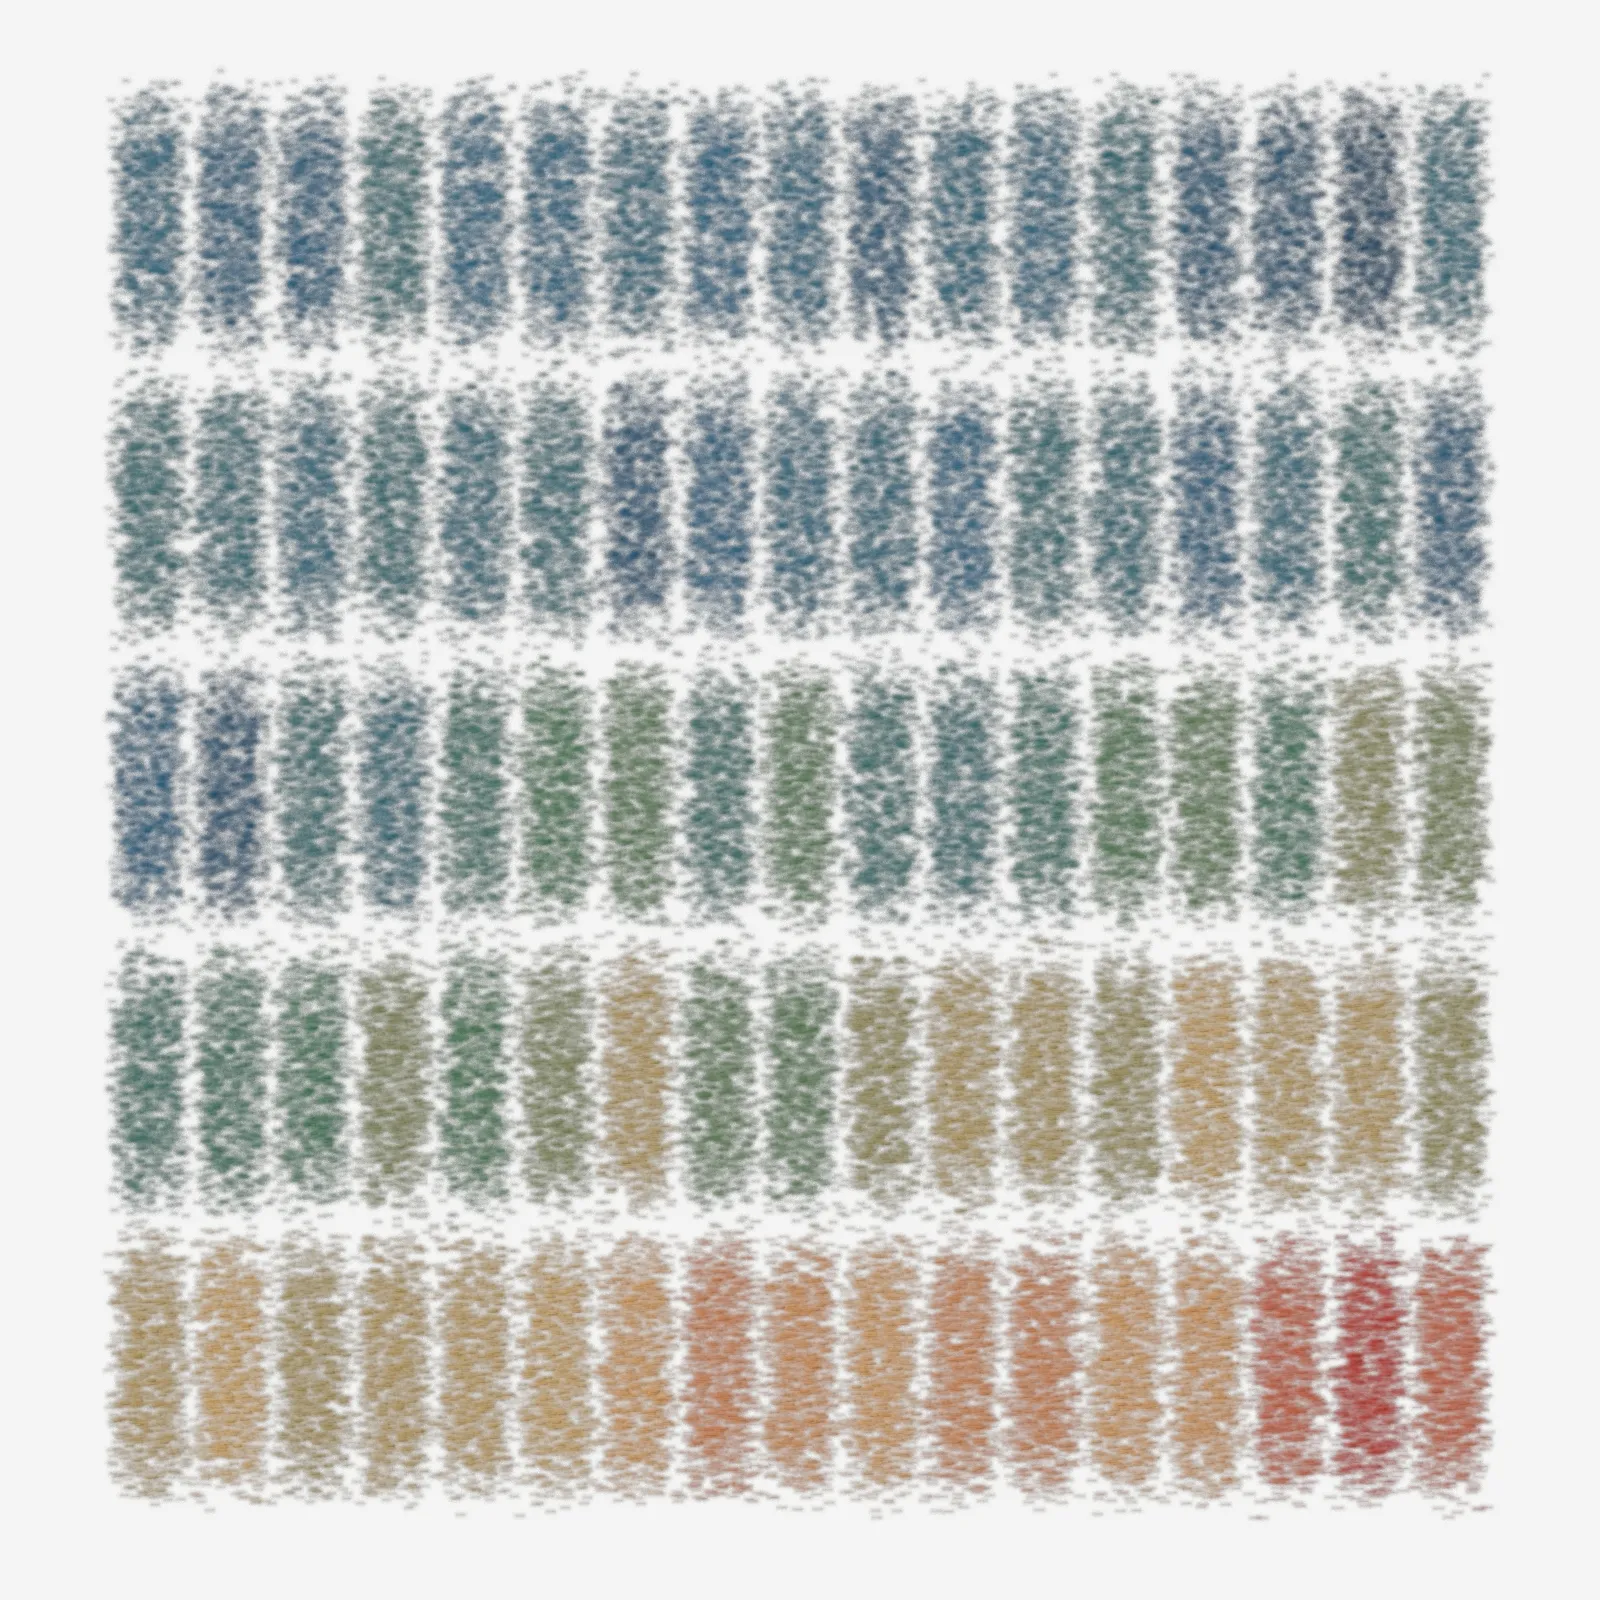
26.020This is probably the most readable work I made. Every block is a year, and inside every block is every day of that year, all taking the colour of the year as a whole. They run in rows from 1941 at the top left to 2025 at the bottom right. It starts in blue and it ends in red.50 x 50 cm · edition of 10$850
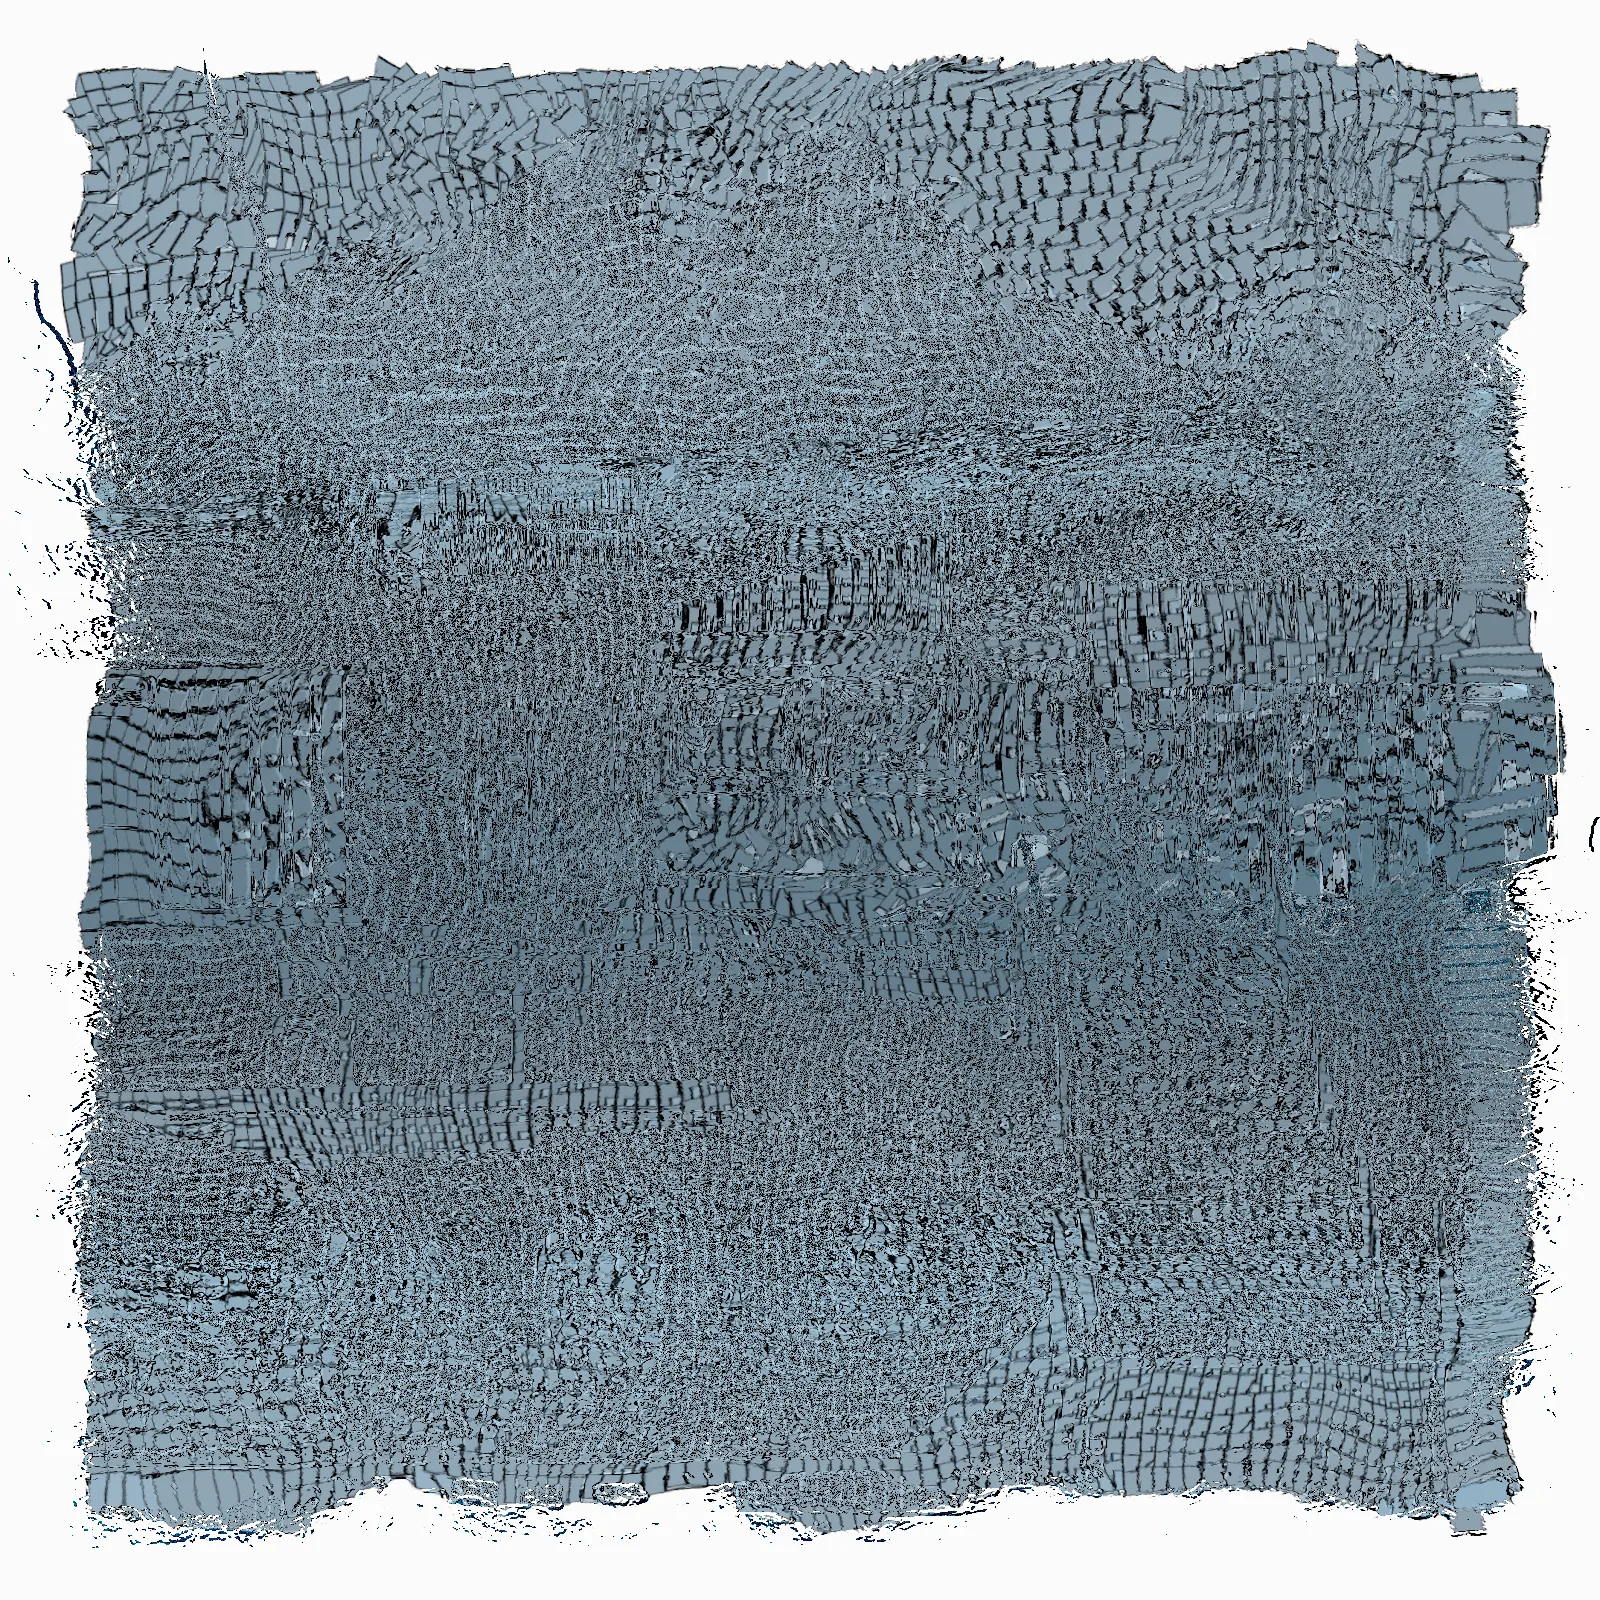
26.001I built this one like a fabric. It seems random but it is not. Every piece is a day of temperature, shaped by the data and by a photograph of mine from Antarctica hidden behind it. The pieces overlap and hide one another, and the colours come from another of my images of the ice. The temperature of the whole planet, laid over the coldest place on it.50 x 50 cm · edition of 10$850
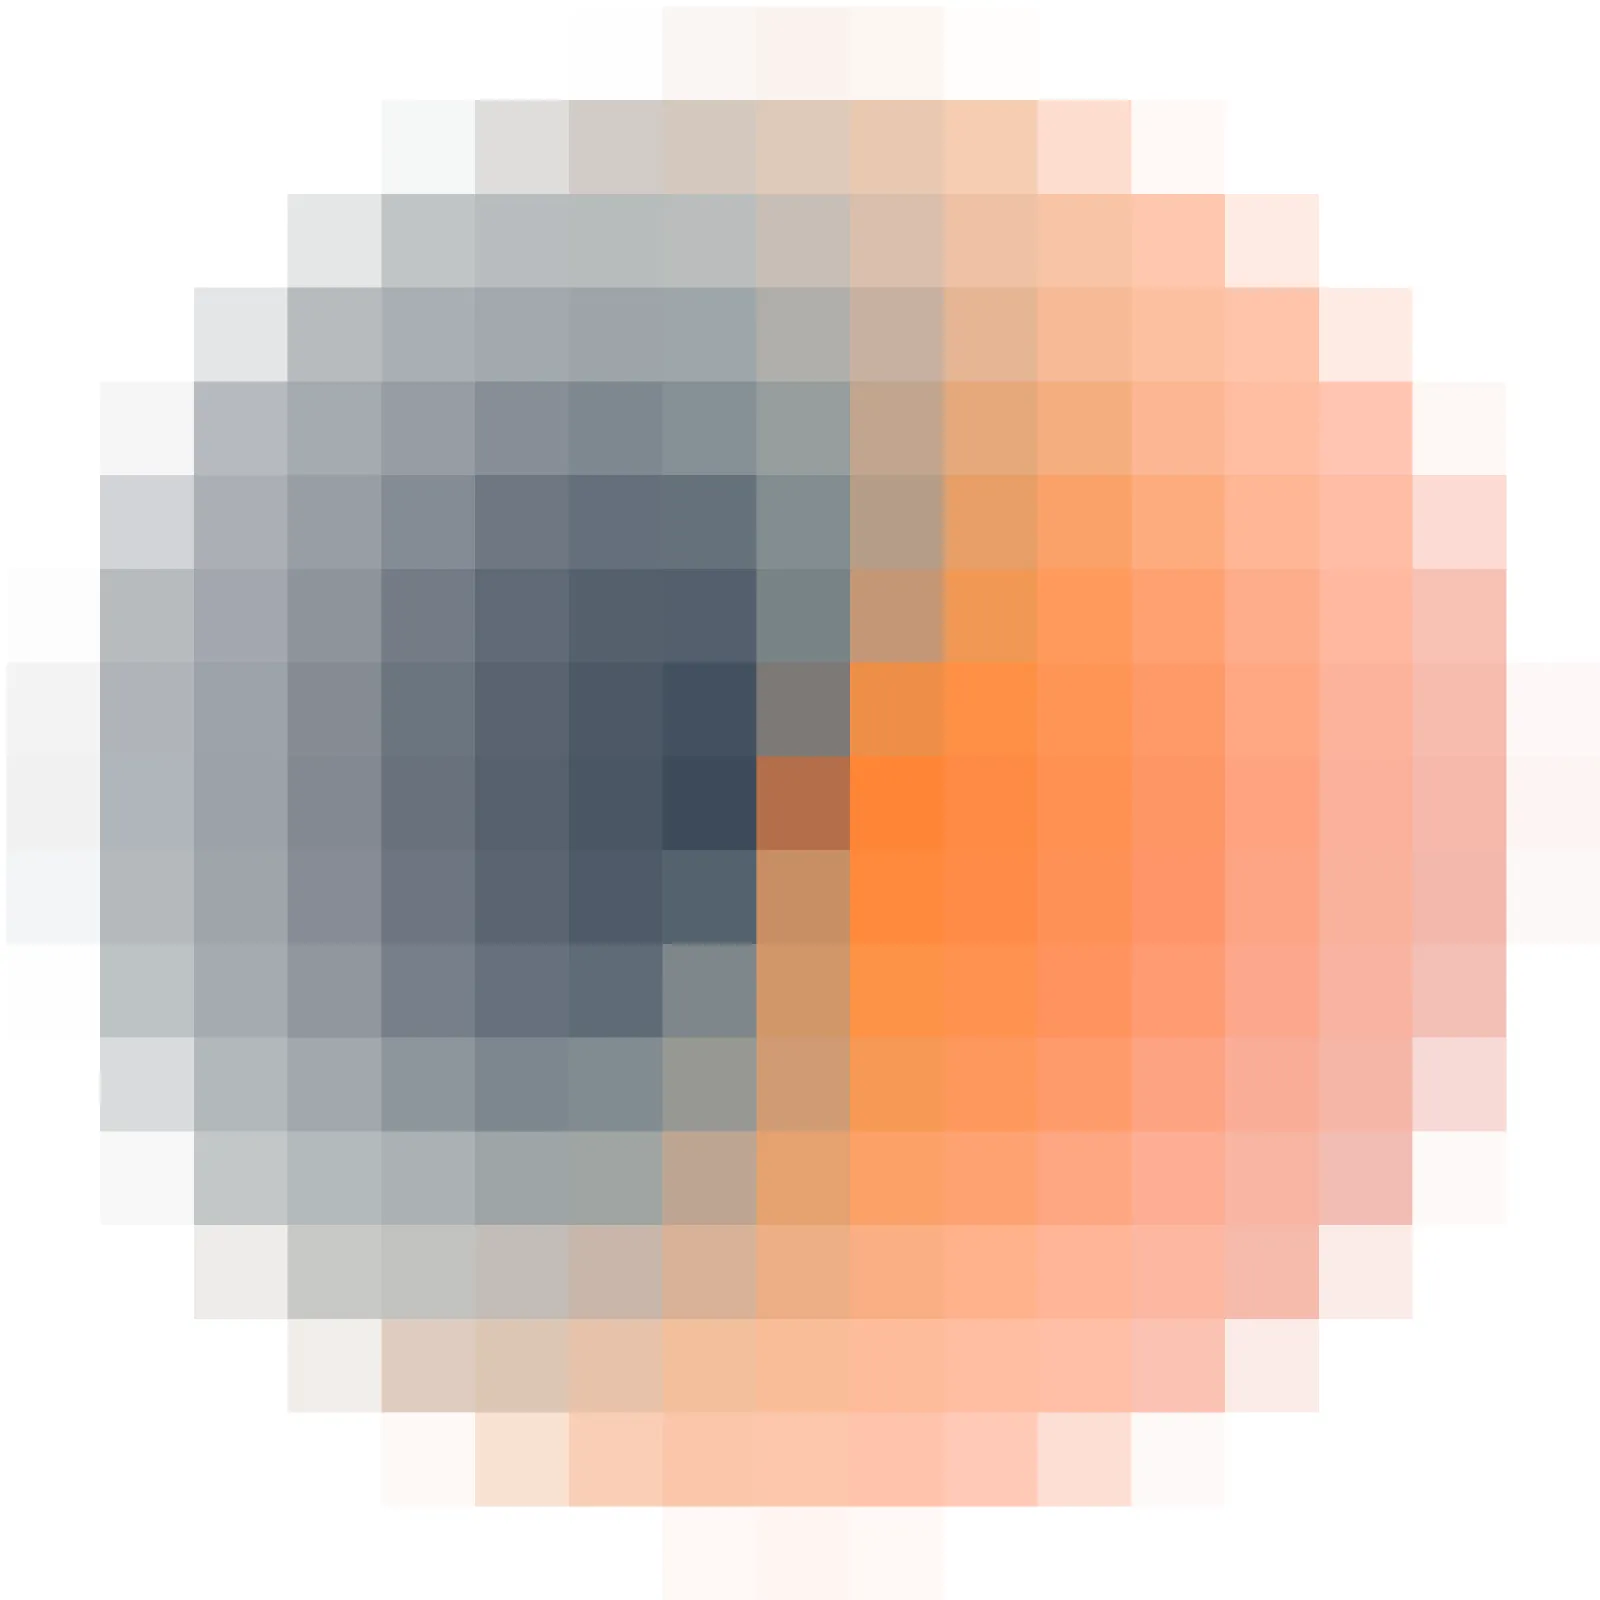
26.108How little would it take? Like a primitive video game, it gives up on detail and approximates everything in a couple of hundred soft squares of colour. Every day is still in here somewhere. I am not after the fine print, only the blurry picture.50 x 50 cm · edition of 10$850
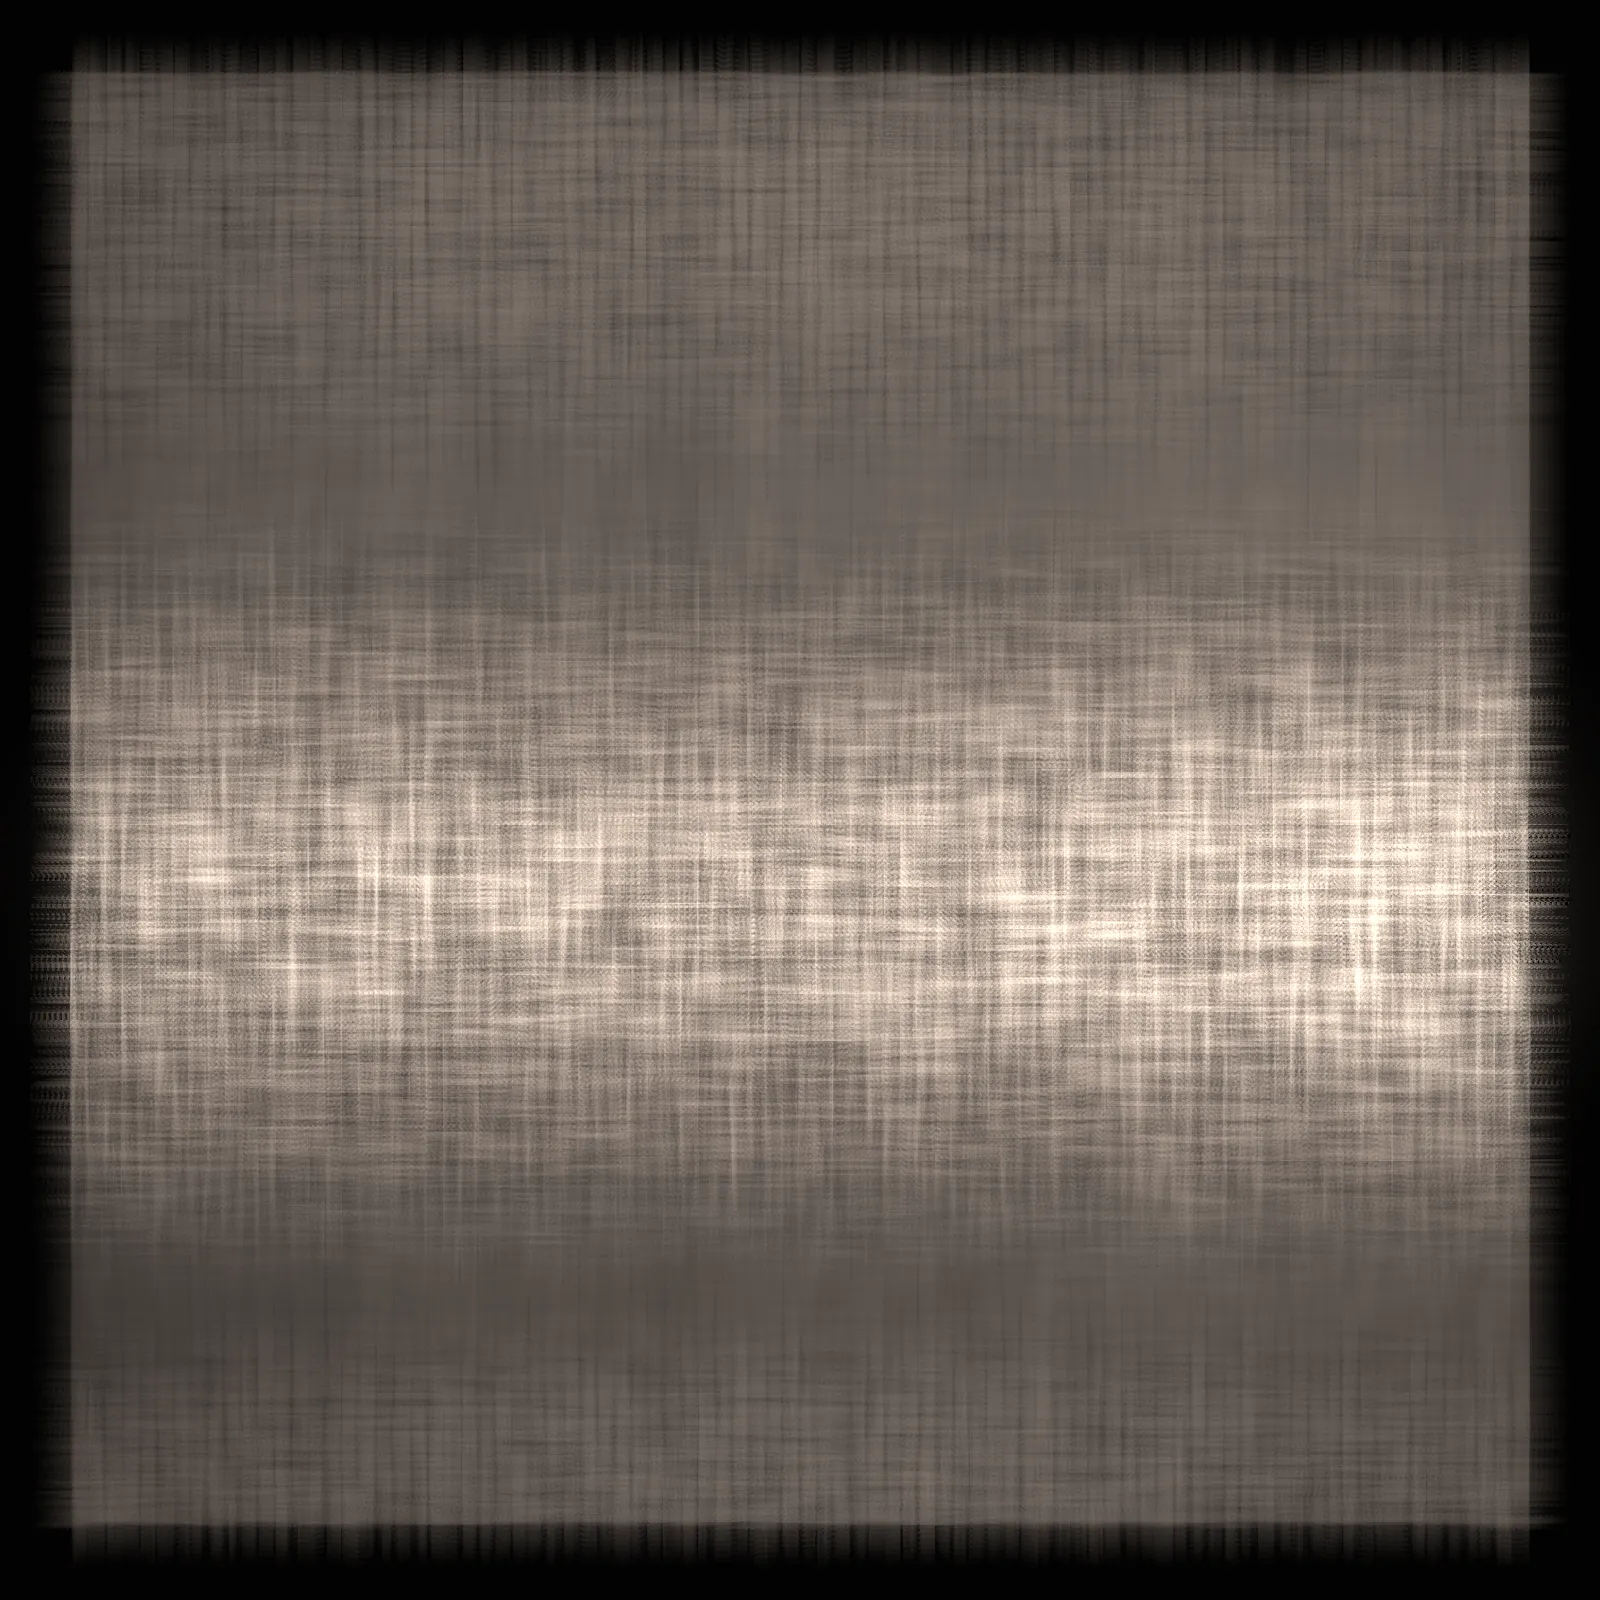
26.011This is a tapestry with a light behind it. The cloth is woven from the days, and something is coming through it, a kind of energy pressing out from behind the threads. I let the detail dissolve until that glow was most of what remained. What interests me here is not the weave but the brightness shining through it.50 x 50 cm · edition of 10$850
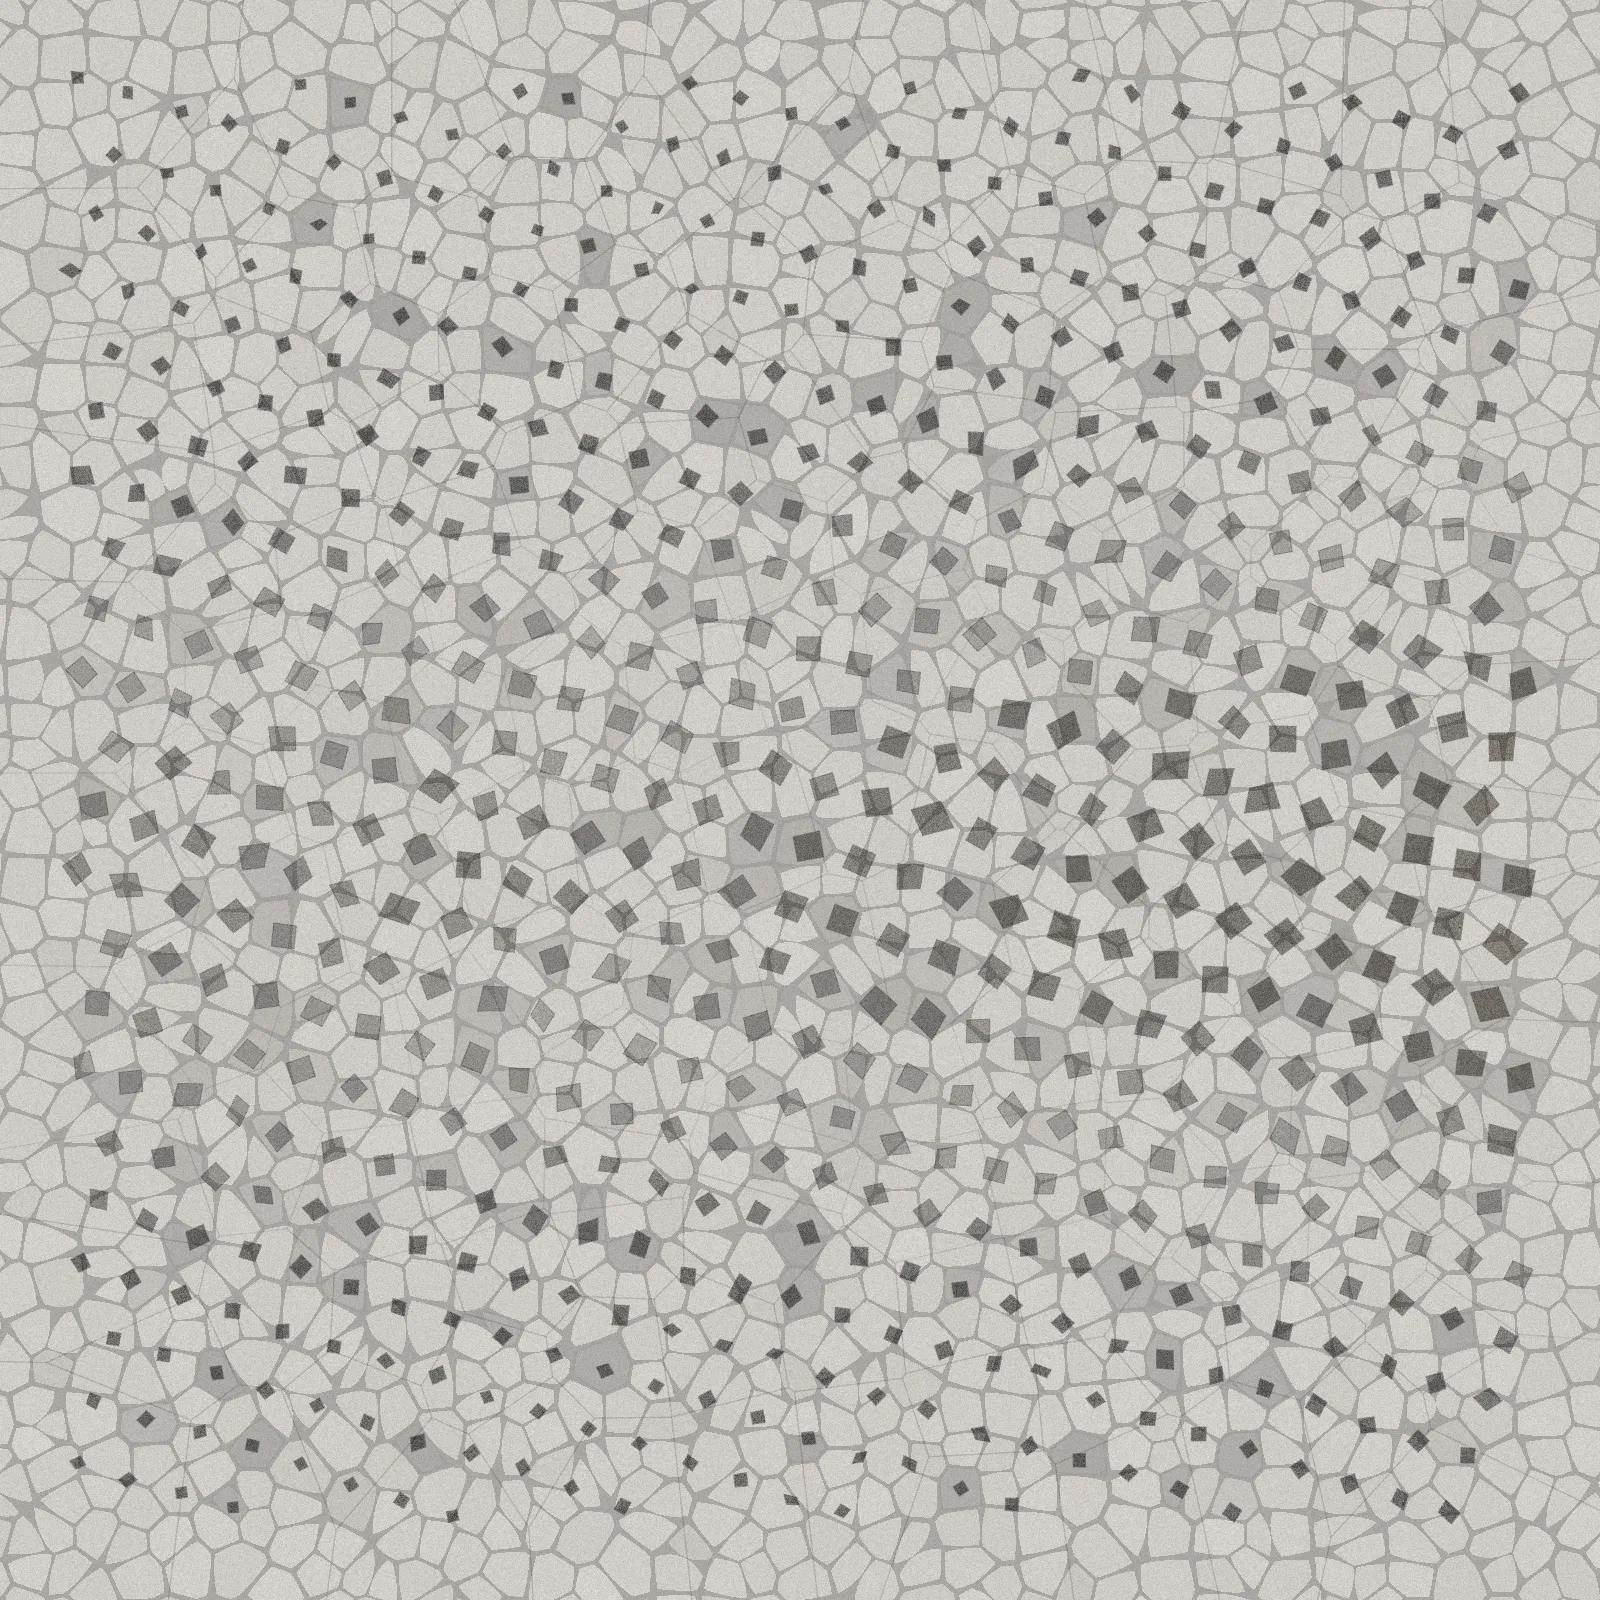
26.012There is a slider in my software that decides how much of the data gets through. Here I pulled it almost to nothing, and one day in fifty survived. What is left is a small sample of chance, colliding across the middle and thinning out above and below, over a pale net of cells like cracked ground. The seasons are still there.50 x 50 cm · edition of 10$850
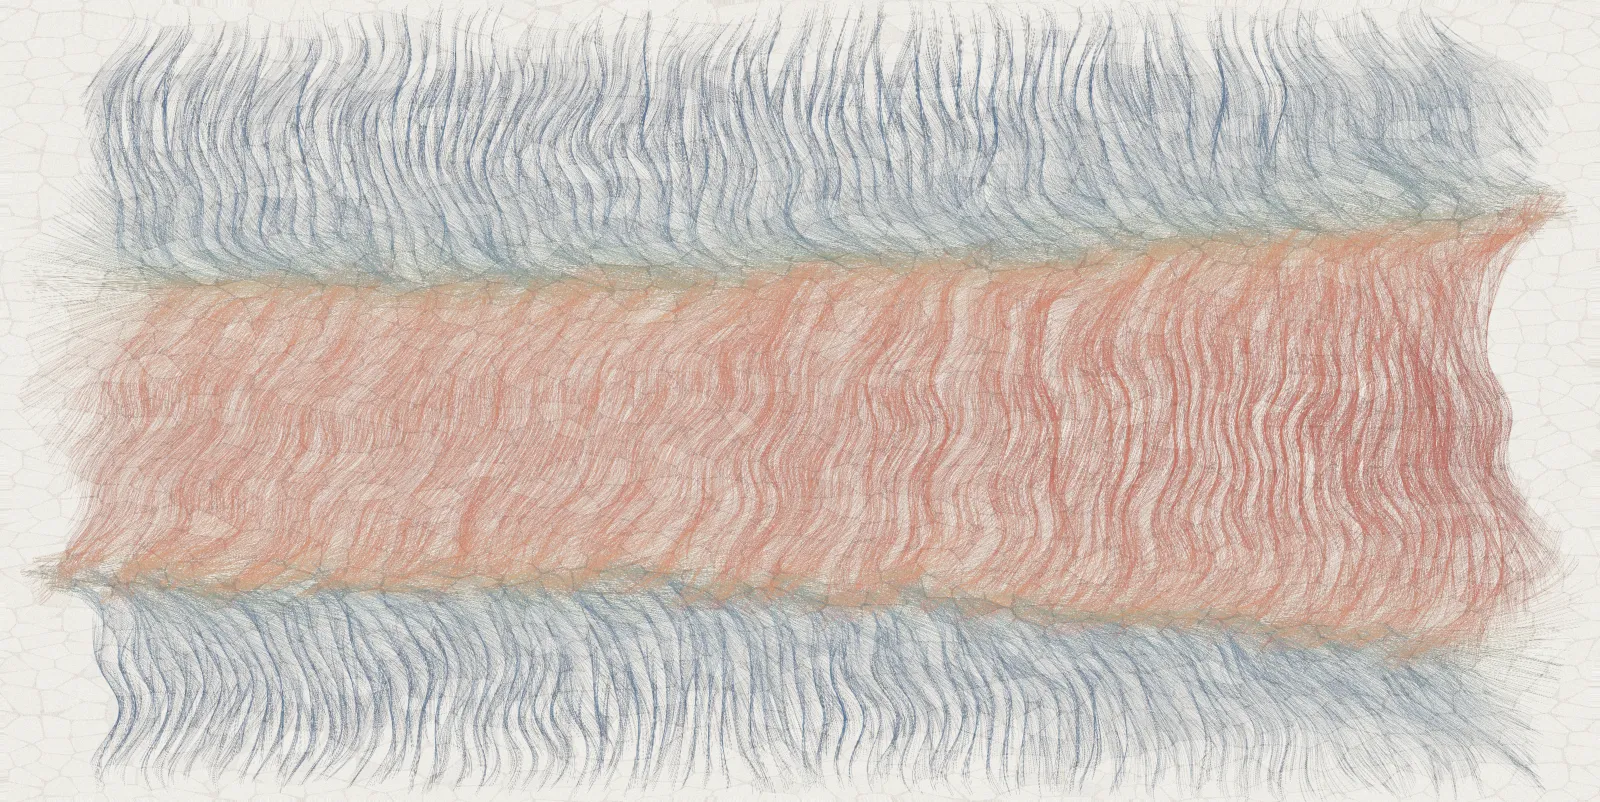
26.103Almost a feather, and one of the plainest works I made. Two seams run its length, and between them the warm part of the year widens towards the present. What I keep coming back to is the fine lines. They are like the fine margins in our climate, each making little difference alone and a great deal of difference together.100 x 50 cm · edition of 10$1,250
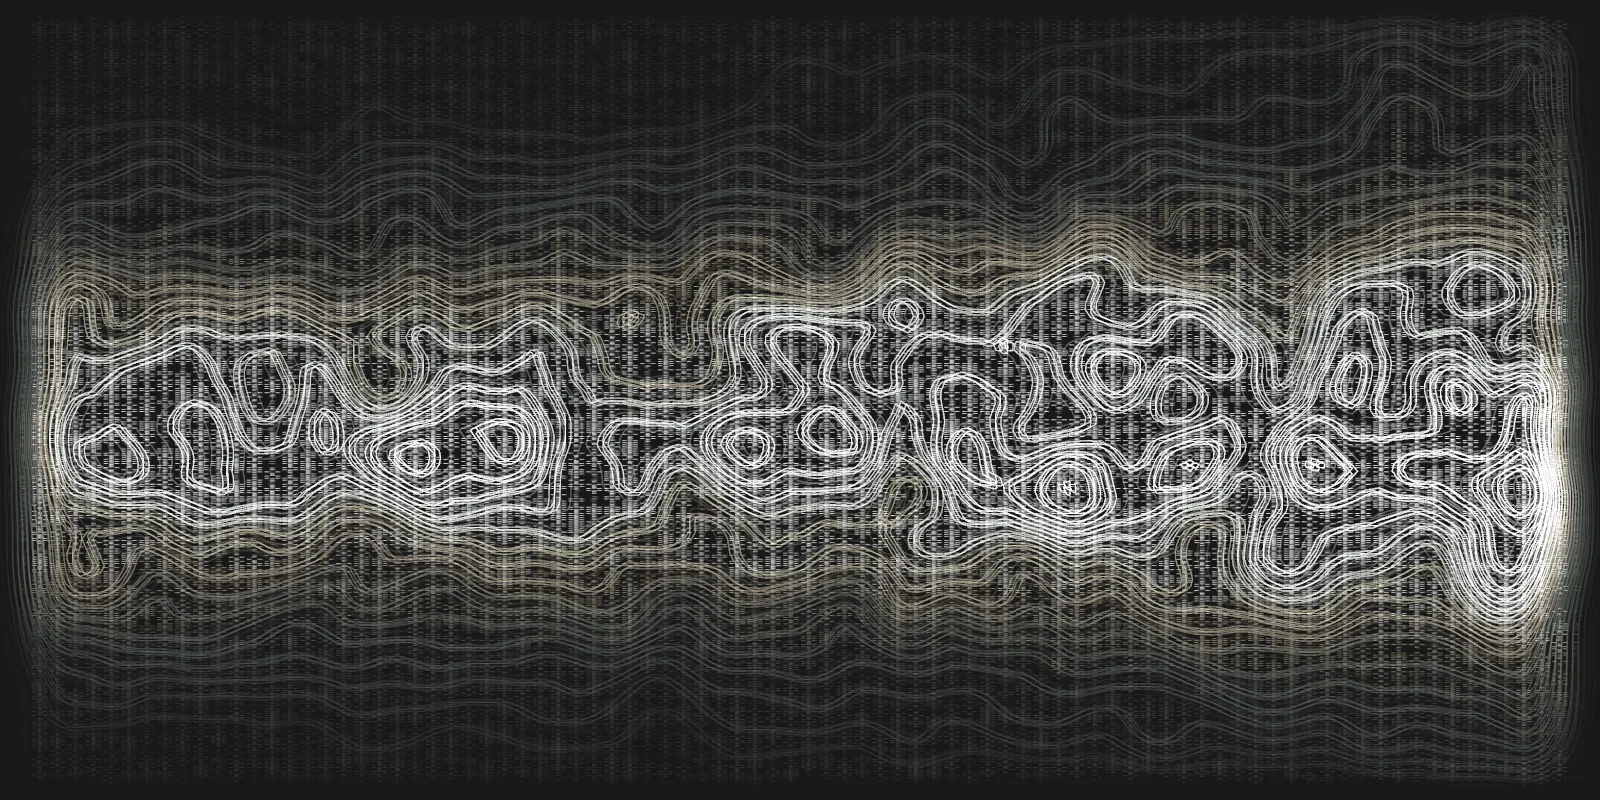
26.100I think of this one as a map of somewhere we can never go. It is an imaginary place, shaped only by temperature. Mountains make their way up out of nothing and keep on growing, and the contour lines follow them as they would on any real map. The place feels as if it exists, but there is no way to get there.100 x 50 cm · edition of 10$1,250
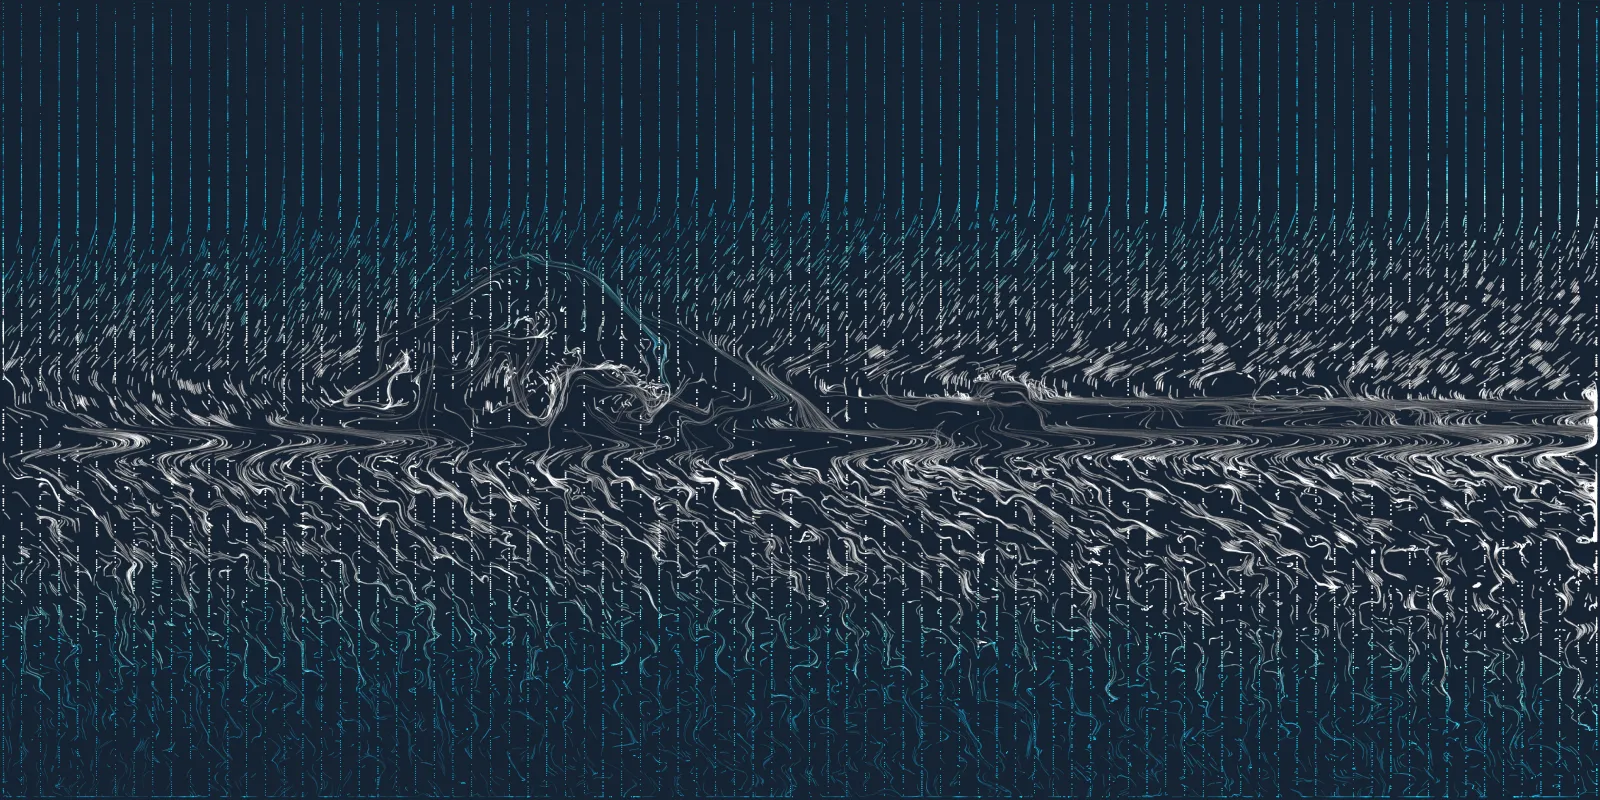
26.104Behind this one is a mountain in Antarctica, from a photograph I took there. Its contours bend the flow of the data as it passes. I set the readings moving as particles and let gravity and wind adjust them, the way time adjusts everything. All that remains is the trails they left. A mountain, the wind and eighty five years, all in a single second.100 x 50 cm · edition of 10$1,250
“As scientists and service providers, we tend to focus on the way our data can be best translated to inform policies and decisions. But importantly, we are also human beings – influenced by emotions that we can’t always explain or control. This beautiful work, generated from our ERA5 climate data, invites audiences to ask the same questions that scientists ask when we look at the data: ‘What are we seeing? What does this mean?’ This is the reason why we provide open-source data at ECMWF, to ensure everyone can interact with information on their own terms, to make sense of humanity’s relationship to the climate.
This stunning exhibition is a prime example that data is art, too. It offers a different way to encounter the history of our climate – not only through analysis and evidence, but through emotion, curiosity and human connection.”
Dr Carlo Buontempo, Director of the Copernicus Climate Change Service (C3S)
I build the tools to create these images. The toolmaking is as much a part of the process as the experimenting that follows. I start with data as the raw material, something recorded from the real world, and turn it into something else entirely. No images are generated by AI.
Every work is printed on Hahnemühle Museum Etching, a 350 gsm, 100% cotton archival fine art paper, and mounted on Alupanel, ready to hang.
Printing and mounting by Pixel Perfect.
Source data: ERA5 daily global 2m air temperature, 1941 to 2025, via Climate Reanalyzer, Climate Change Institute, University of Maine. Contains modified Copernicus Climate Change Service information 2026. Neither the European Commission nor ECMWF is responsible for any use that may be made of the Copernicus information it contains.